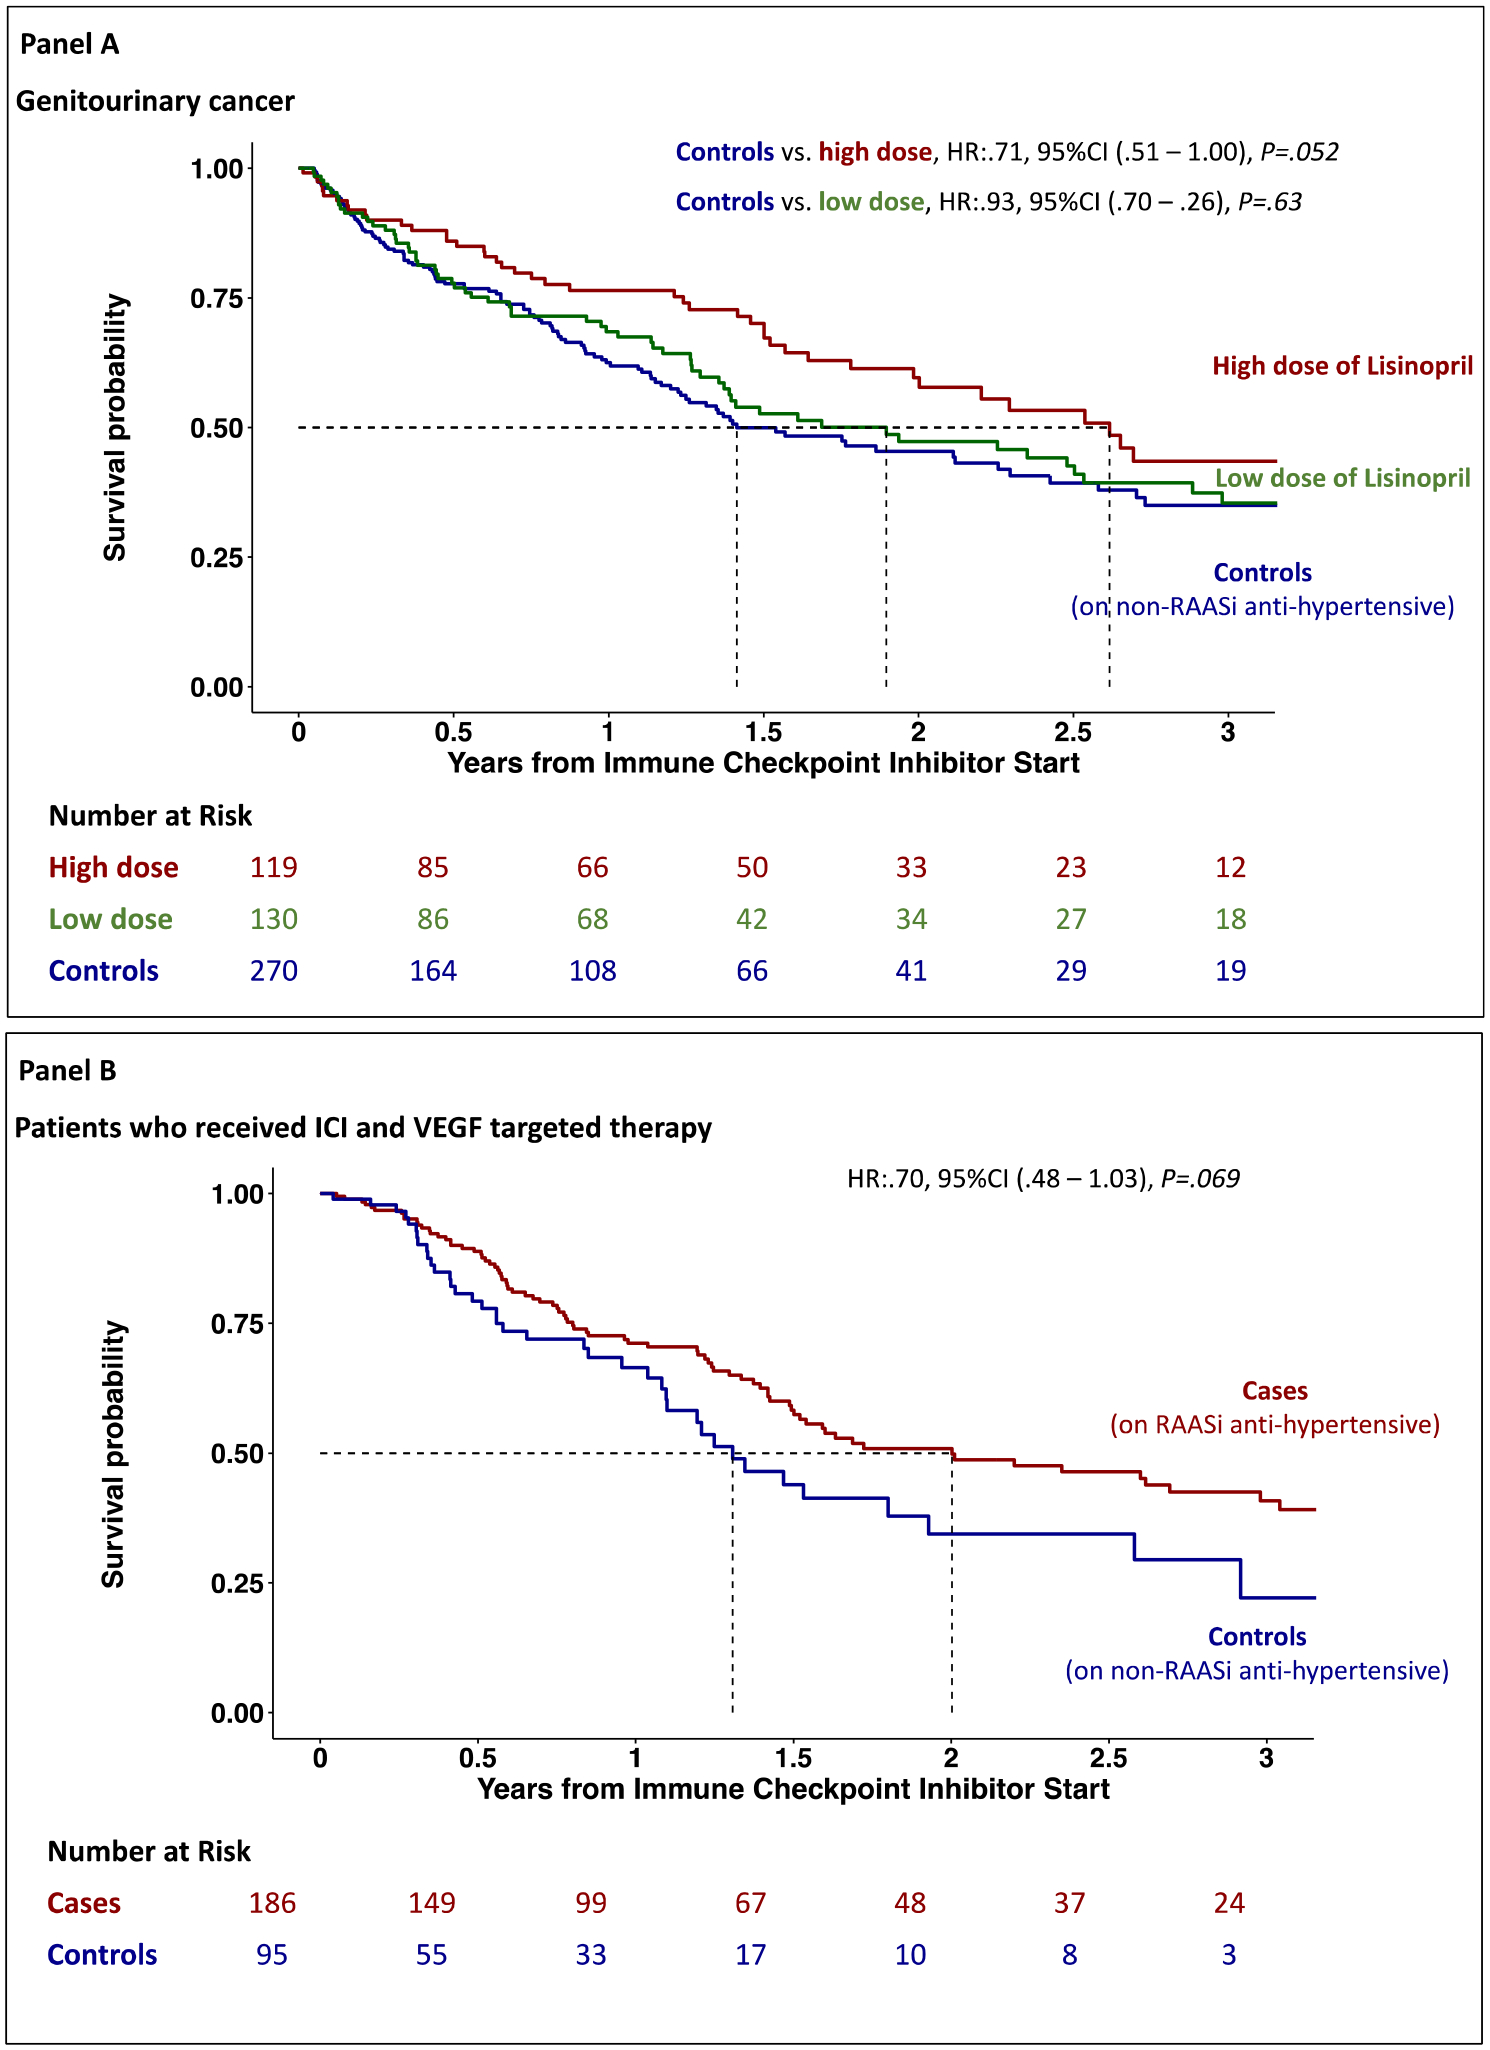
Fig. 3. Kaplan–Meier curves of the survival probability over time after starting immune checkpoint inhibitor therapy.

Panel A shows patients with genitourinary cancer who were taking Lisinopril and controls patients who were on non–renin–angiotensin–aldosterone system (RAAS) inhibitor anti-hypertensive therapy. Panel B shows overall survival in patients who received ICI and VEGF-targeted therapy.
