
Figure 2.
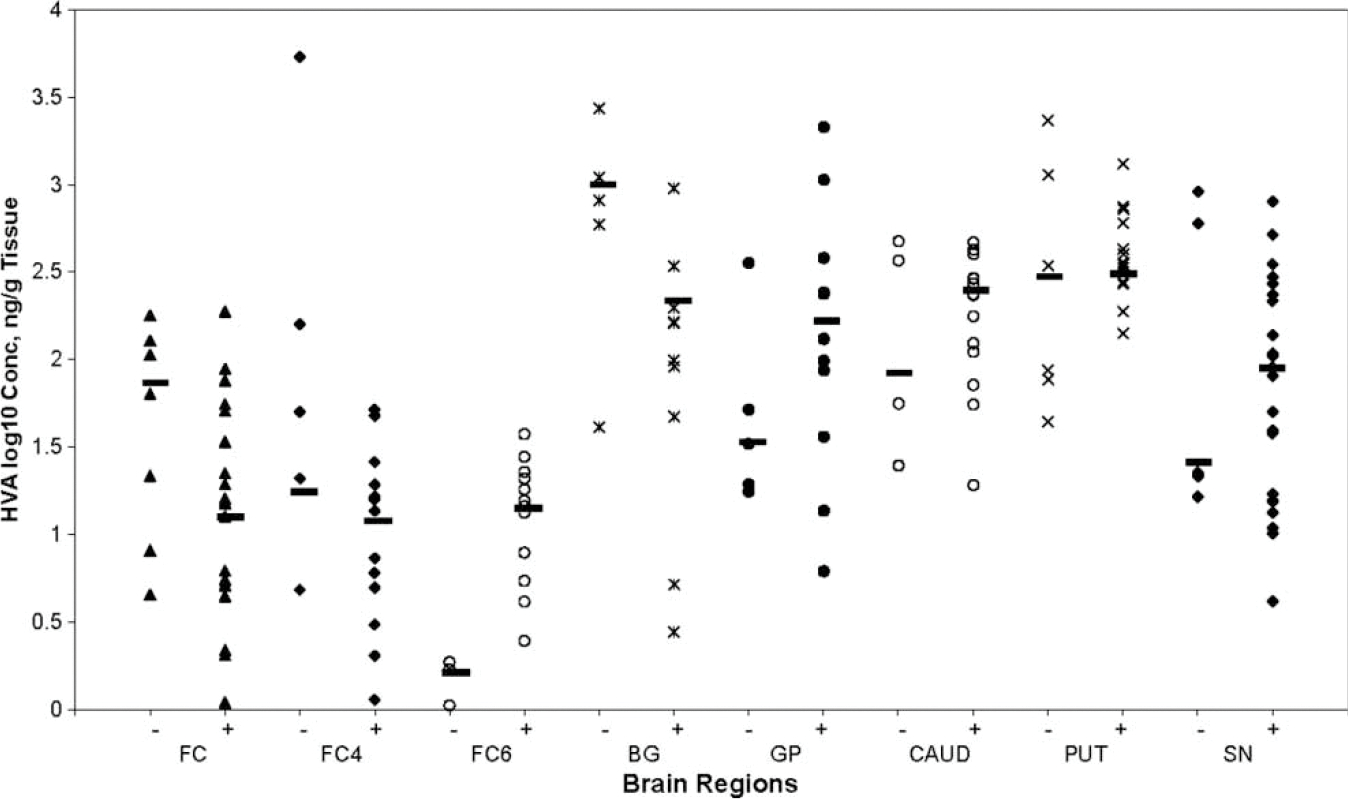
Scatter plot showing HVA concentration (y-axis, log10 ng/g tissue) in each brain region (x-axis) of HIV-1+ and HIV-negative individuals. The horizontal lines represent the median value in each region. There was no significant change found in the values of HVA in each region of HIV-1+ brain compared to that in HIV-negative brain.