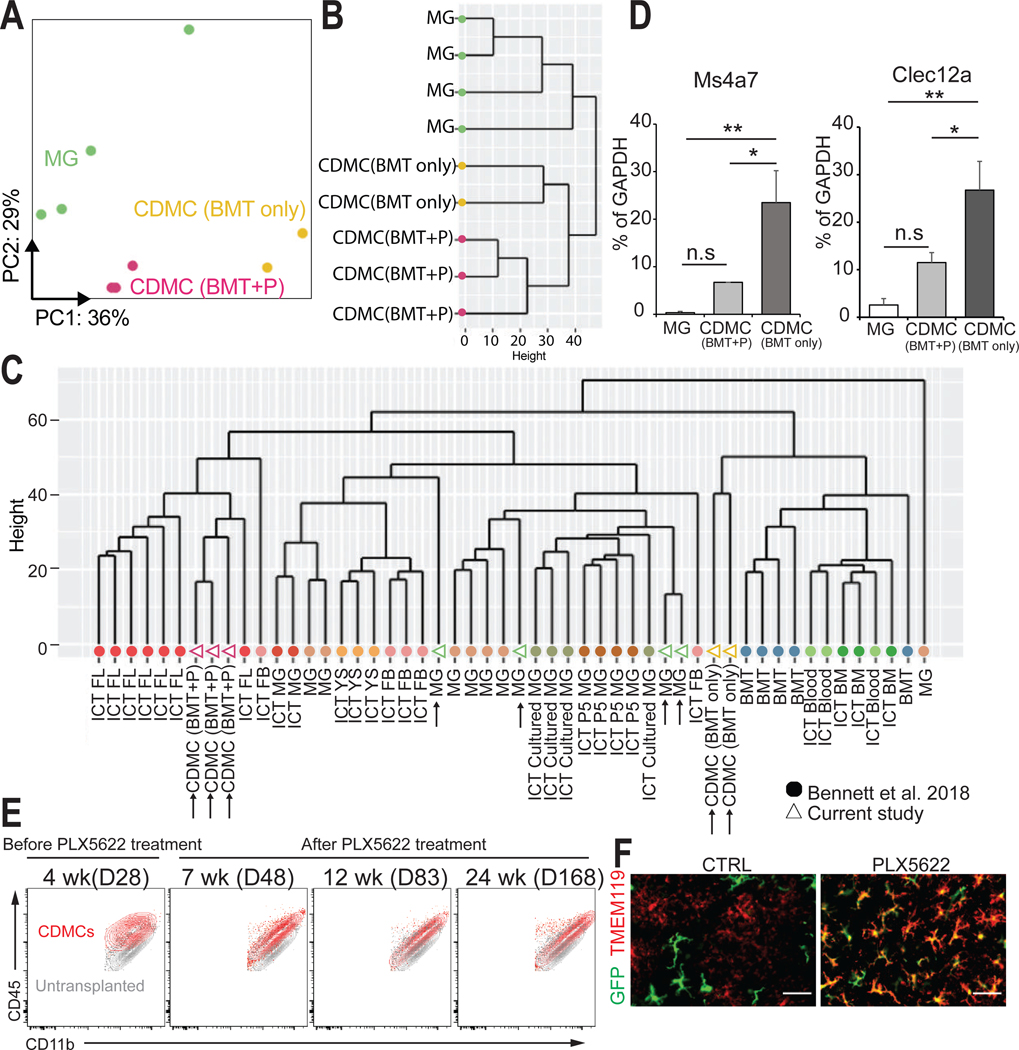
Fig. 3. CDMCs and microglia are transcriptionally distinct cells.
(A) Principal component analysis (PCA) plot for microglia (n=4, green), CDMC (BMT+P) (n=3, purple), and CDMC (BMT only) (n=2, yellow) using 2,500 most variable genes. Ellipses demarcate 95% confidence interval for assigned clusters.
(B) Unsupervised hierarchical clustering of microglia, CDMC (BMT+P) and CDMC (BMT only).
(C) Unsupervised hierarchical clustering of our dataset and a published dataset of various microglia-like cells of different origins (24). Our samples are shown as open triangles and the published data as filled circles. CDMC after BMT with PLX5622 treatment (CDMC (BMT+P)), CDMC after conventional BMT without PLX5622 treatment (CDMC (BMT only)), microglia (MG), intracranial transplanted (ICT)-P5 microglia (ICT P5 MG), ICT-cultured microglia (ICT cultured MG), ICT-adult microglia (ICT MG), ICT- yolk sac cells (ICT YS), ICT-fetal brain cells FB (ICT FB), ICT-fetal liver cells (ICT FL), ICT-BM cells (ICT BM), ICT-PB (ICT Blood), Bone marrow transplanted by IP (BMT).
(D) Quantitative real-time PCR analysis of bone marrow-derived microglia-like cell marker Ms4a7 and Clec12a in microglia and CDMCs (Mean ± SEM, n=6, *p < 0.05, **p < 0.01, ns: not significant, ANOVA).
(E) Overlaid density plots of CDMCs (red) of BMT+PLX5622 protocol (BMT+P) at the indicated time points and myeloid cells of untransplanted mice (gray).
(F) Representative images of GFP+ and TMEM119+ cells in the cortex on D83. Scale bars: 50 μm.

