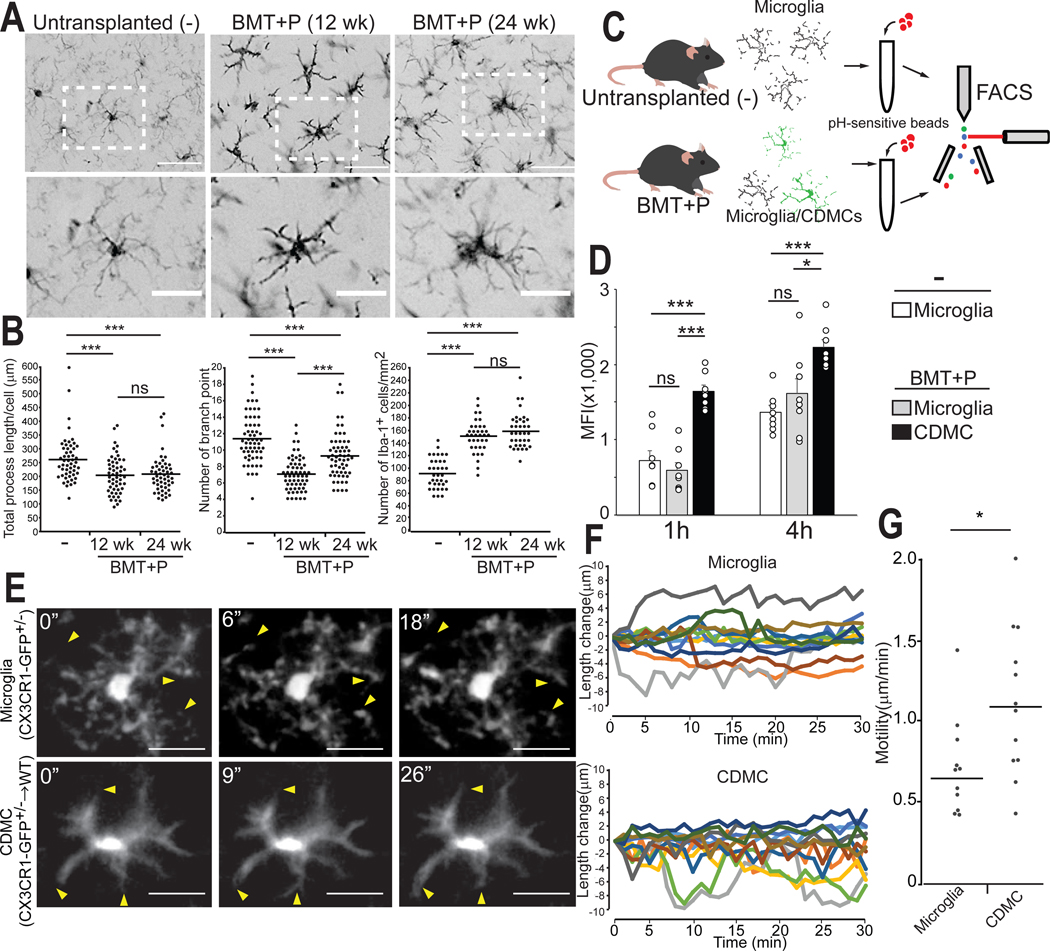
Fig. 4. CDMCs are morphologically and functionally similar but distinct from microglia.
(A) Representative images of Iba-1+ cells in the cortex of untransplanted mice (−), mice after BMT+P (12 weeks after transplantation), and mice after BMT+P (24 weeks after transplantation). Lower panels are enlarged images of the boxed areas in the upper panels. Scale bars: 50 μm (upper), 25 μm (lower).
(B) Quantitative, morphological analysis of Iba-1+ in the indicated samples. Left: total length of processes. Center: number of branch points. Right: cell density (Horizontal bars represent median values, n=3/group, 3 brain slices/animal were quantified, ***p < 0.001, ns: not significant. ANOVA).
(C) Schematic overview of in vitro phagocytosis assay of brain myeloid cells. Phagocytosis of pH-sensitive fluorescent beads was analyzed by flow cytometry.
(D) Mean fluorescence intensity (MFI) of pH-sensitive fluorescent beads in the indicated samples 1 and 4 hours of incubation (Mean ± SEM, n=8, *p < 0.05, ***p < 0.001, ns: not significant, ANOVA)
(E) Microglia (CX3CR1-GFP+/−) and CDMCs (CX3CR1-GFP+/→WT) were visualized in vivo by two photon microscopy. Individual frames from 30 min time-lapse imaging of microglia (upper) and CDMCs (lower). Representative images shown. Arrow heads indicate extension and retraction of processes. Scale bars: 25 μm.
(F) Changes in process length were analyzed in 8 cells/group (total of 12 processes/group). Images were taken every 1 min for 30 min.
(G) Motility of processes in microglia and CDMCs. (Horizontal bars represent median values, n=12 processes/group, *p < 0.05, Student’s t-test)

