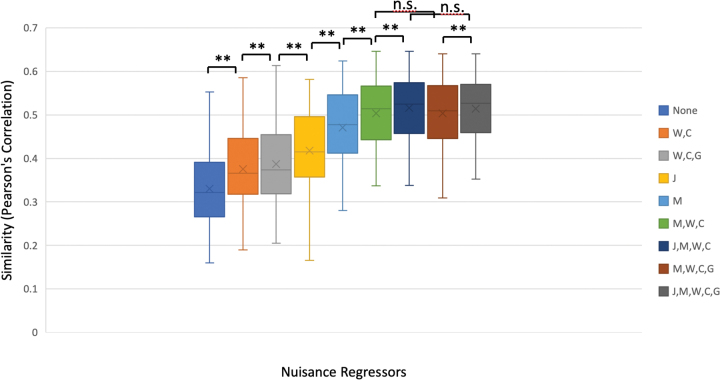
FIG. 10.
Box plots showing the similarity between each subject's functional connectivity matrix and the group average functional connectivity matrix, for different sets of nuisance regressors: None, J = JumpCor, M = estimated motion parameters, W = average signal over white matter and the temporal derivative, C = average signal over CSF and the temporal derivative, G = average signal over the whole brain (global) and the temporal derivative. **(p < 0.001), n.s. (p > 0.2). The inclusion of the JumpCor regressors together with the estimated motion (M) and tissue based regressors (W, C, G) results in a significant increase in similarity between the individual subject and group connectivity matrices. No significant differences in similarity were observed with versus without the inclusion of the global signal and its derivative when the other regressors (J, M, W, C) were included. n.s., not significant. Color images are available online.

