FIG. 6.
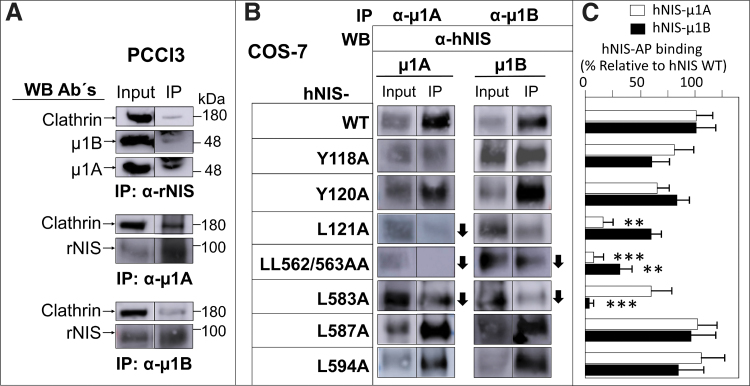
Analysis of NIS interaction with clathrin-dependent μ1A and μ1B. (A) Western blotting using the indicated antibodies (left) against PCCl3 input or IP complexes with rNIS (top), μ1A (middle), or μ1B (bottom) antibodies. (B) Western blotting of COS-7 cells cotransfected with WT hNIS or the indicated mutants (left) and with μ1A or μ1B, as indicated. Following IP with μ1A or μ1B, extracts were immunoblotted with a rabbit polyclonal anti-hNIS antibody. Input or IP fractions are indicated. The arrows highlight a decrease in the signal when compared with WT hNIS. The bands shown for each IP and Western blot are from the same membrane but were separated in the original Western blot. Western blots are representative of at least two experiments. (C) Estimation of the interaction of μ1A or μ1B with hNIS. The NIS signal obtained in the IP fraction was standardized to the input and then normalized to the interaction observed in the hNIS WT protein. Data represent the mean ± SD of at least three experiments. Differences vs. control (MDCK-hNIS WT) were considered significant: **p < 0.01; ***p < 0.001. IP, immunoprecipitated; WT, wild type.

