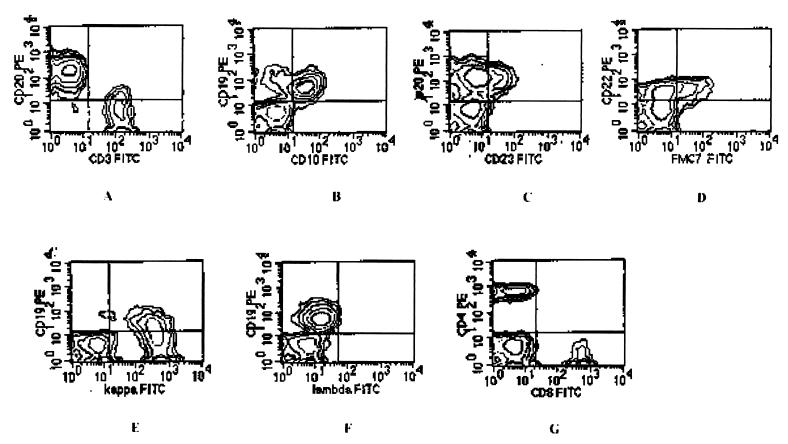
FIG. 1.
Contour plots showing flow cytometry profile. (A) CD20+ B-cell population (21%) and CD3+ T-cell population (34%); (B) coexpression of CD19 and CD10; (C) coexpression of CD20 and CD23; (D) CD22 and FMC7 expression; (E) kappa light chain restriction; (F) normal expression of lambda chain; (G) T-cell population (21% CD4–12% CD8). FITC, fluorescein isothiocyanate; PE, phycoerythrin.

