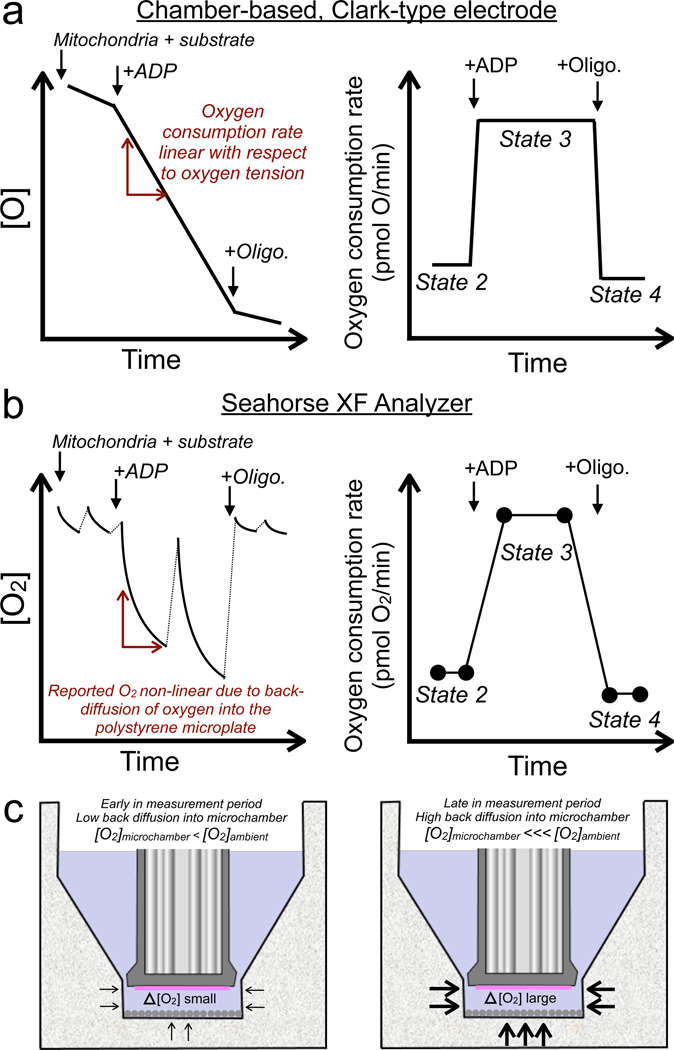
Figure 2 -. Calculation of respiratory rates in common measurement platforms.
Hypothetical experiments with isolated mitochondria are presented. (a) (left) Platinum, Clark-type electrodes with closed, glass reaction chambers display linear decreases in oxygen tension, from which the oxygen consumption rate can be directly calculated (right). (b) (left) In the XF Analyzer, the instrument forms a transient, semi-closed ‘microchamber’ to measure the decrease in oxygen tension over a defined measurement period (almost always 2–3 min) interspersed with regular mixing and reoxygenation of the experimental medium. The reported decrease in oxygen tension is non-linear due to the backflow of oxygen through the polystyrene microplate and into the microchamber. (right) A series of empirically-calibrated calculations by the XF Wave software is required to deconvolute the effect of oxygen backflow and generate quantitative oxygen consumption rates from the reported changes in oxygen tension. (c) Scheme of the XF Analyzer well showing how the amount of oxygen back-diffusion into the well changes with the oxygen consumption rate. As the measurement period proceeds, the difference in oxygen tension between the microchamber and the ambient environment increases, driving more oxygen across the microplate and into the chamber. Oligo,, oligomycin.

