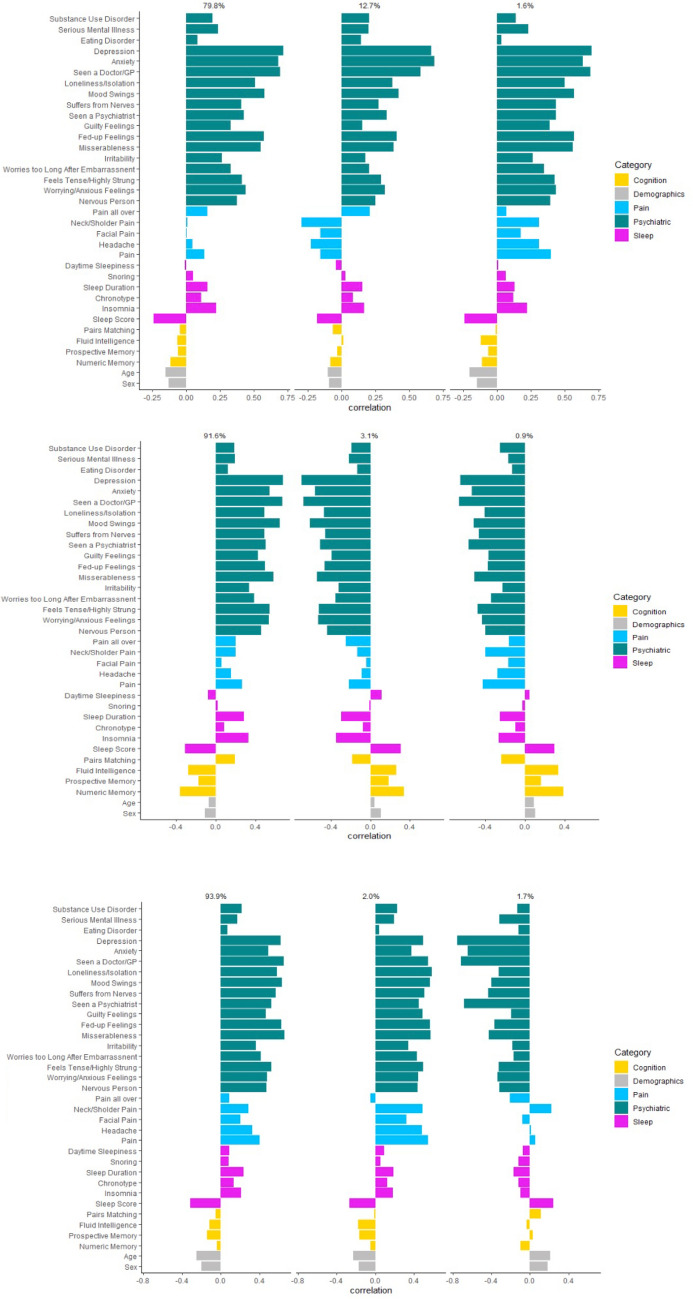
Fig. 3.
Three genetically informed phenotypic axes that represented the most phenotypic variance for A the overall dystonia cohort, B cervical dystonia and C dystonic tremor. Above each axis is the proportion of phenotypic variation it represents. Seen a GP/doctor and seen psychiatrist refer to seeing the specified professional for nerves, anxiety, tension, or depression. A positive correlation (bars going to the right) indicates increased psychiatric, pain and sleep disturbance, but improved cognitive performance

