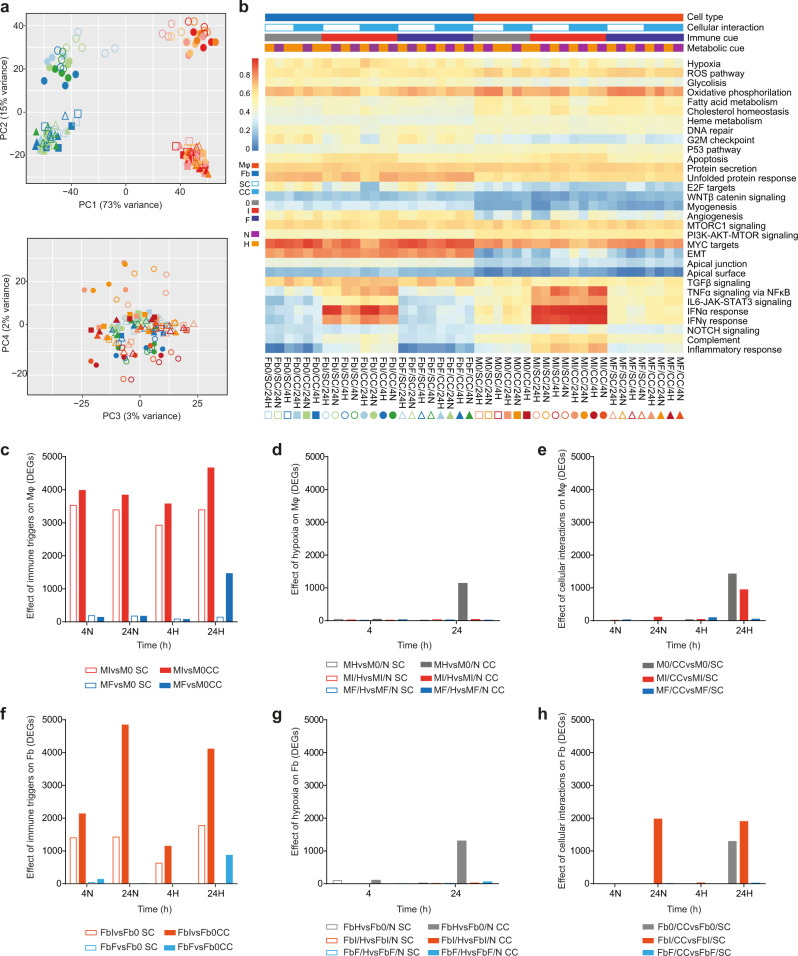
Fig. 1. Global transcriptome analysis of macrophages (Mφ) and fibroblasts (Fb) exposed to distinct immune, metabolic and culture conditions.
a PCA on all samples indicates that the 2 components describing most of the system variability are represented by the cell type and inflammation (73% - PC1 and 15% - PC2, respectively, in the upper panel). Other sources of variability are not detectable (see PC3 and PC4 in the bottom panel). For sample codes refer to Fig. 1b. b Single sample GSEA (ssGSEA) on the hallmark database of enriched gene ontologies. Labels indicate 44 sample conditions (columns) and hallmark categories enriched (rows). Samples are grouped by cell type (Mφ or Fb), cellular interaction (CC or SC), immune cues (0 or I or F) and metabolic cue (H or N; Mφ and Fb in different shades of orange or blue, respectively). Different shape and color indicate different sample conditions: squares = resting (0), circles = proinflammatory (I) and triangles = profibrotic (F); empty and full shapes are related to single culture (SC) and coculture (CC), respectively; different shade of color are related to time (4 or 24 h) and oxygen status (N = normoxia, H = hypoxia). c–h Quantification of differentially expressed genes (DEG; FDR ≤ 0.05) in Mφ and Fb depending on immune cues, hypoxia, or cellular interaction. c reports the effect of immune cues comparing proinflammatory or profibrotic Mφ to resting Mφ (MIvsM0 = red bars, MFvsM0 = blue bars, respectively) in SC or CC (empty and full bars, respectively) at 4 or 24 h of normoxia (4 N or 24 N) or hypoxia (4H or 24H). d reports the effect of hypoxia on Mφ comparing hypoxic to normoxic Mφ in resting (MHvsM0/N = gray bars), proinflammatory (MI/HvsMI/N = red bars) and profibrotic (MF/HvsMF/N = blue bars) conditions, in SC or CC (empty and full bars, respectively), both at 4 or 24 h. e reports the effect of Fb on Mφ comparing cocultivated to single cultivated Mφ in resting (M0/CCvsM0/SC = gray bars), proinflammatory (MI/CCvsMI/SC = red bars) and profibrotic (MF/CCvsMF/SC = blue bars) conditions at 4 or 24 h of normoxia (4 N or 24 N) or hypoxia (4H or 24H). f–h report the same comparisons of c–e, respectively, but performed on Fb. Source data of c–h are provided as a Source Data file.

