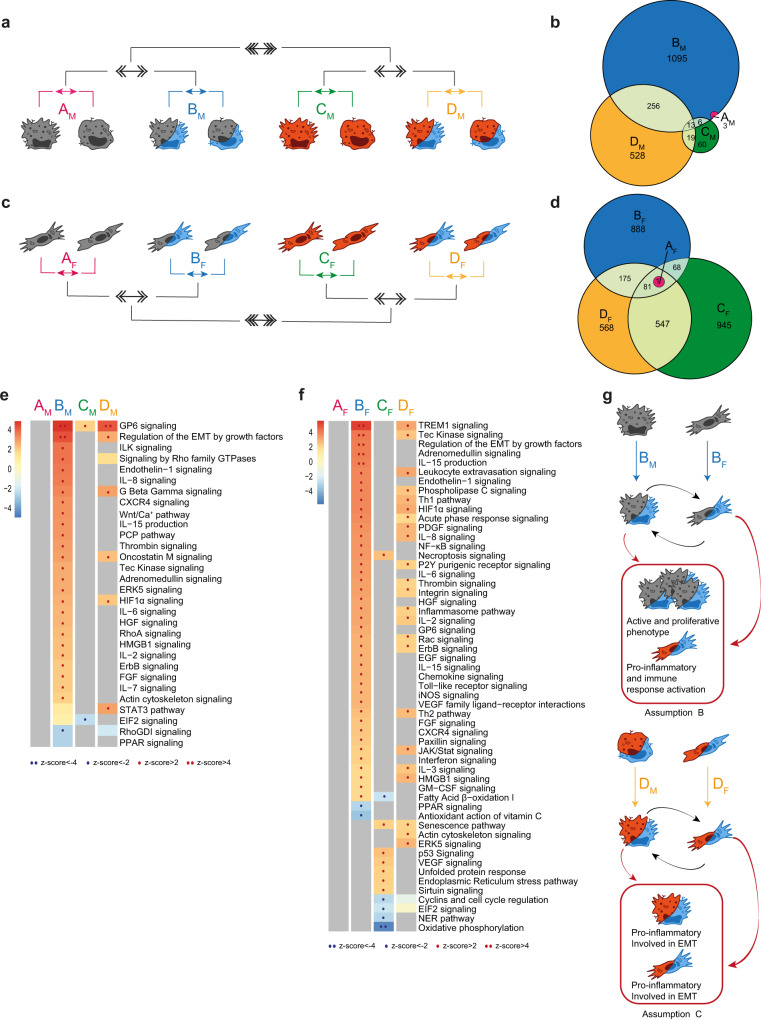
Fig. 5. Role of cellular interplay on the global biological response.
a, c Schematic representation of the multi-level approach to study the effect of Fb on Mφ (a, b, e) and of Mφ on Fb (c, d, f) in a tissue-like setting with different metabolic and immune conditions.1st level compares cocultivated cells to single cultivated cells in four different conditions: in normoxic and resting (comparison AM/AF in pink), in hypoxic and resting (BM/BF in blue), in normoxic and inflamed (CM/CF in green), in hypoxic and inflamed (DM/DF in yellow). 2nd level (double arrows) compares normoxic to hypoxic environments (AvsB and CvsD) and 3rd level (triple arrows) compares resting to proinflammatory conditions [(A+B)vs(C+D)]. b, d Venn diagrams show the distribution of DEGs in each 1st level comparison in Mφ (b) and Fb (d). e, f Pathways enrichment analysis in Mφ (e) and Fb (f) comparisons. Columns represent 1st level of comparisons (A-B-C-D), rows report pathways significantly modulated (|z-score | ≥ 2) in at least one comparison. Color intensity bar indicates the level of positive (in red) or negative (in blue) enrichment; dots appear only when pathways are significantly enriched; gray indicates no modulation. See also Fig. S6. g Schematic representation of cellular changes in the key condition which feeds assumptions B and C in the mathematical model. Source data of heatmaps e, f are provided as a Source Data file.

