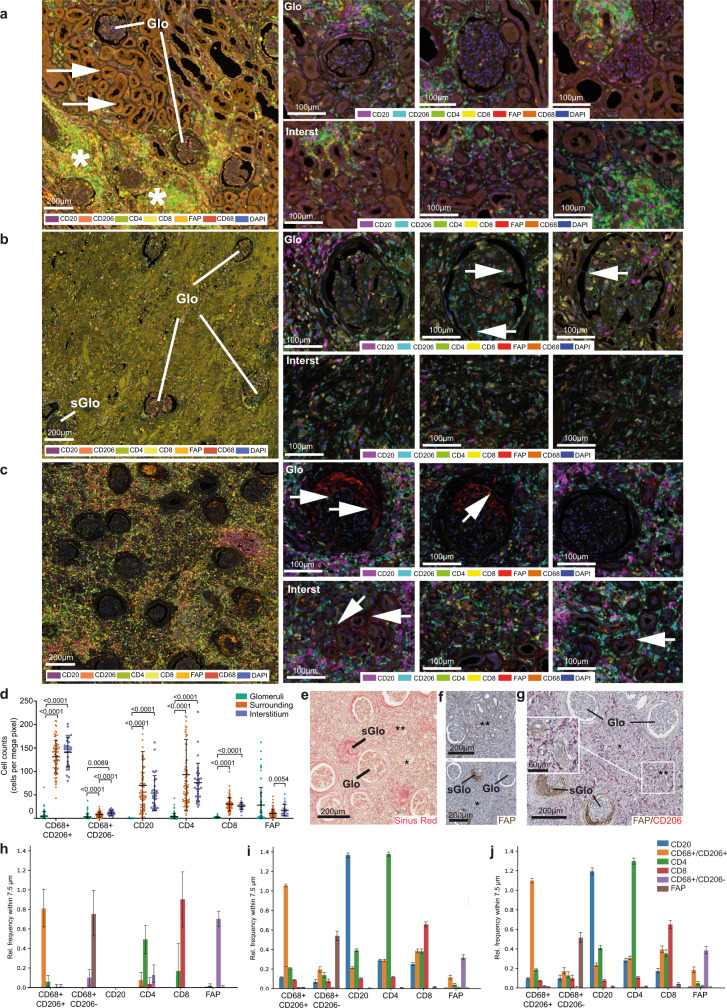
Fig. 6. Different stages of fibrosis and heterogeneity of immune cell infiltrates characterizing distinct anatomical kidney regions.
a–c Multiplexed immunohistochemistry of transplant nephrectomy samples in a acute cell-mediated rejection (TCMR; BANFF type IIa), b chronic antibody-mediated rejection (ABMR), and c active stage of fibrosis (ca. 90% IF/TA; BANFF category 5, grade III) with signs of chronic rejection consistent with combined TCMR and ABMR. The left panel of a–c shows fluorescent whole slide scans for overview in tissue context. The right three panels show region-specific immune cell phenotyping in multiple fields of view after multispectral unmixing (see color code in right panel of a–c). While multiplexed immunohistochemistry was performed in only a single final experiment, all immunohistochemical staining results for individual markers (FAP, CD206, CD68, CD4, CD8, CD20) have been systematically controlled by chromogenic single- and duplex immunohistochemistry on consecutive sequential sectioning levels (Fig. 6f, g, and ref. 27). Representative examples of the glomerular compartment (Glo) and the tubulointerstitial areas (Interst) are displayed. Co-existence of almost normal Glo and tubulointerstitial areas (a, left panel, arrows) and severely inflamed regions (a, left panel, asterisks) can be observed. Glomeruli were almost devoid of Mφ with few exceptions (b, right panel, arrows). If present in glomeruli, Mφ were rarely in direct neighborhood to FAP+ myofibroblasts (c, right panel, arrows). d Scatter plot representing cell density of different cell types: macrophages (CD68+/CD206+, CD68+/CD206−), T lymphocytes (CD8+, CD4+), B lymphocytes (CD20+) and activated myofibroblasts (FAP+), in the same case as presented in (c) in each anatomical compartment (glomeruli (G), Points indicate results for each ROI, N = 79; surrounding (S), N = 79; interstitium (I), N = 31; center line represents mean values, whiskers depict SD. Two-way ANOVA with Tukey’s multiple comparisons test were used to evaluate the differences (p-values are reported on the graph). e Sirius red staining (corresponding to c) showing co-existence of morphologically almost intact Glo and sclerotic glomeruli (sGlo), and tubulointerstitial areas ranging from severe (**) to moderate/low fibrosis (*). f IHC for FAP (corresponding to c), showing co-existence of almost normal Glo and areas of massive myofibroblast activation (sGlo), and tubulointerstitial areas ranging from severe (**) to moderate/low myofibroblast activation (*). g Duplex immunohistochemistry (corresponding to c) confirmed the heterogeneous distribution of activated myofibroblasts (FAP+), and alternatively activated CD206+Mφ in different anatomical regions. h–j Neighborhood analysis on multiplexed IHC. For each region, glomeruli (h), interstitium (i) and surrounding (j), each cell of interest indicated on the horizontal axis (CD68+/CD206+,CD68+/CD206−, CD8+,CD4+,CD20+, and FAP+) was evaluated for the relative frequency of the corresponding cell types (vertical axis) within a radius of 7.5 μm. Data are presented as mean values (top of bar graph) with SD (whiskers). The number of analyzed cells was (h) CD68+/CD206+ n = 99, CD68+/CD206− n = 50, CD8+ n = 18, CD4+ n = 78, CD20+ n = 0, and FAP+ n = 462; iCD68+/CD206+ n = 15179, CD68+/CD206− n = 1356, CD8+ n = 3659, CD4+n = 9286, CD20+ n = 4756, and FAP+ n = 1443; j CD68+/CD206+ n = 1072, CD68+/CD206− n = 37, CD8+ n = 265, CD4+ n = 829, CD20+ n = 810, and FAP+ n = 69. Source data of the multiplex immunohistochemistry experiment depicted in Fig. 6d, h–j are provided as Source data files and in Zenodo repository.

