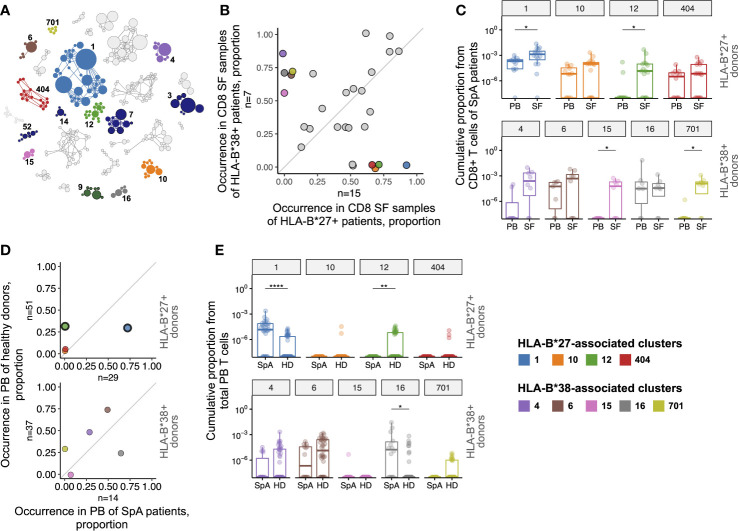
Figure 2.
T cell clonotypes involved in immune response in synovial fluid of SpA patients. (A), Similarity network of SF CD8+ clonotypes identified by the ALICE. Only 29 clusters shared by ≥3 patients are shown. Each node represents a unique amino acid clonotype. Edges connect clonotypes differing in one CDR3 amino acid residue. Node’s size corresponds to the number of donors sharing this clonotype. Color highlights clusters associated with HLA-B*27, HLA-B*38, or found in VDJdb. (B), Occurrence of the clusters in CD8+ SF samples of HLA-B*27+ (n=15) vs HLA-B*38+ (n=7) patients. (C), T cell frequency of HLA-B*27-associated (upper, n(PB)=12, n(SF)=16) or HLA-B*38-associated (bottom, n(PB)=7, n(SF)=8) clusters in CD8+ repertoires of patients. Occurrence (D) and T cell frequency (E) of HLA-B*27-associated (upper, n(SpA)=29, n(HD)=51) or HLA-B*38-associated (bottom, n(SpA)=14, n(HD)=37) clusters in total PB repertoires of SpA patients and HD. Black circles mark clusters significantly enriched by Fisher’s exact test with Benjamini-Hochberg adjusted p<0.05. On the box plots the middle line corresponds to the median, the lower and upper hinges correspond to the 25th and 75th percentiles, respectively. The upper and lower whiskers extends from the hinges to the largest and smallest values no further than 1.5 * IQR from the corresponding hinge. Each dot represents an individual sample. For patients with relapses only repertoires of time point 1 were included in the analysis. PB - peripheral blood, SF - synovial fluid, SpA - spondyloarthritis, HD - healthy donors. Wilcoxon rank sum test with Benjamini-Hochberg adjustment *p < 0.05, **p < 0.01, ****p < 0.0001.

