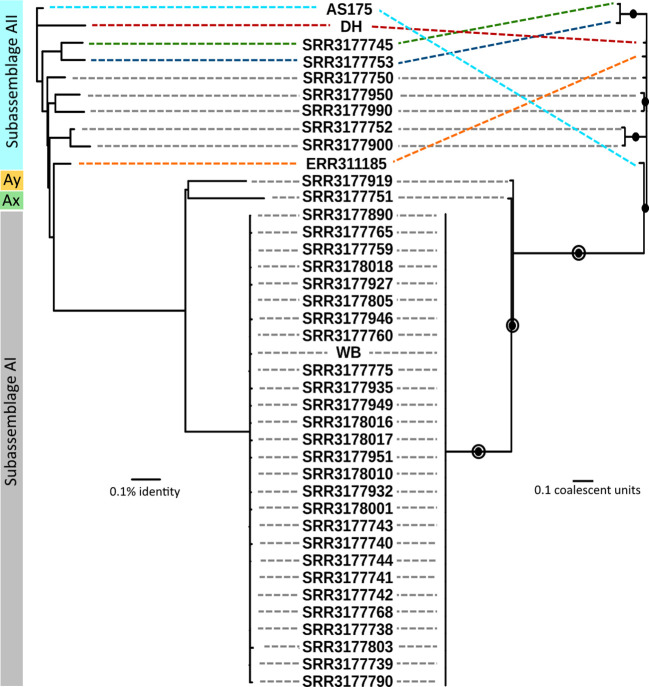
Figure 2.
Comparison of genomic relatedness using ANI and multilocus coalescent estimations. Left side: ANI tree constructed from pairwise comparisons of draft genomes. Right side: Coalescent tree estimated by ASTRAL-III using gene trees from all pangenome loci. Filled circles indicate nodes with greater than 95% bootstrap support. Open circles indicate nodes with greater than 95% support in the set of trees estimated by STACEY. Grey dashed lines indicate concordant placement of a genome on opposing trees. Colored dashed lines indicate specific genomes which had differing placement.

