
FIGURE 1.
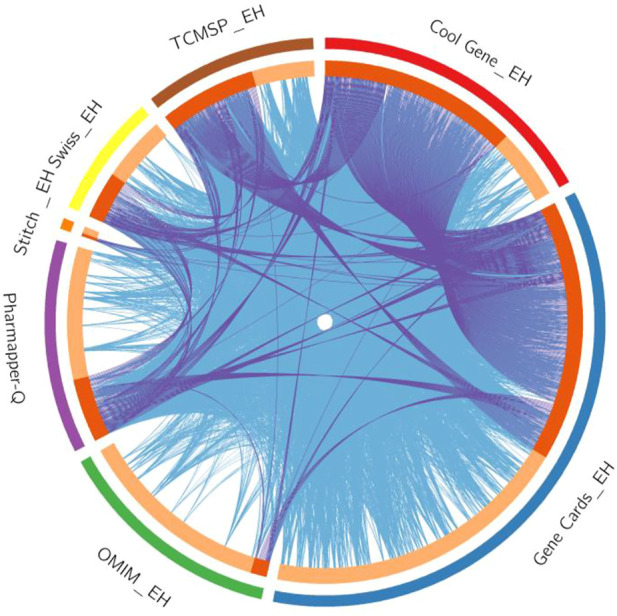
The Circos plot shows intersecting genes. The outer arcs symbolize the identity of each gene. Each of the inside arcs represents a gene, and each gene is represented by its own spot on the arc. The dark orange color indicates genes found in multiple databases, whereas the light orange color signifies genes found only in that gene datasets. Purple lines connect identical gene that seems in specific genes databases. Blue lines connect the genes that identified as similar ontologies.