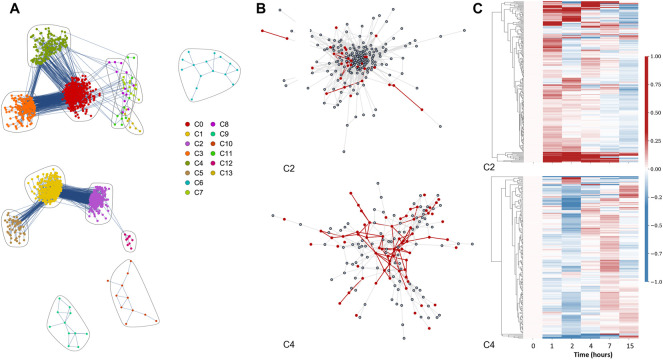
FIGURE 3.
Differential network analysis for the B cell experiment. (A) Differential network with community structure found by the Louvain community detection method. (B) Isolated visualizations of C2 (top) and C4 (bottom) communities with red highlights indicating genes found in statistically significant Reactome pathways (FDR<0.05), and their corresponding edges in the network. (C) Heatmaps of C2 (top) and C4 (bottom) over 15 h (6 time points). Columns represent time points while rows denote genes. These row data demonstrate the difference in each entry’s expression relative to time 0. The relative values were determined by subtracting the individual time points from time point 0 and then normalizing using a Euclidean norm, so that each row ranges from -1 (down-regulation) to 1 (up-regulation). For the dendrogram clustering we used the complete-linkage method (Farthest Point Algorithm) Defays (1977); Hartigan (1985).

