
Figure 4.
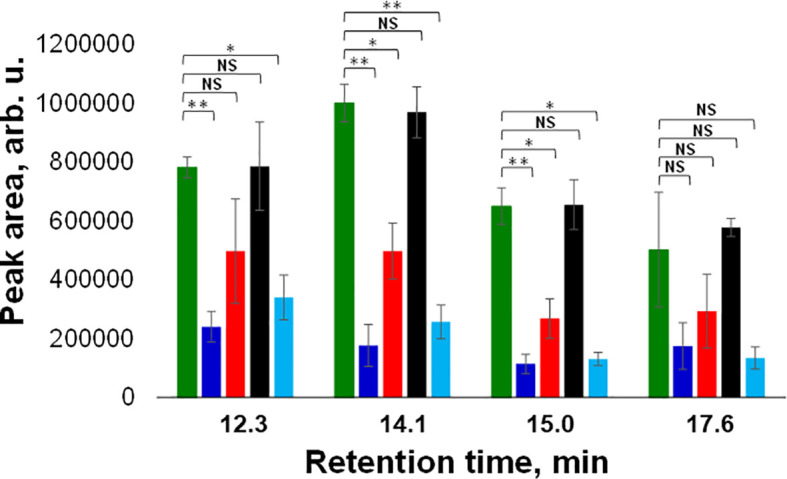
Average peak area and corresponding standard deviations of peaks observed in triplicates of HPLC profiles of healthy (green), ND- (light blue) and drought (black) stressed plants, as well as wheat exposed to WSMV+TriMV infection (red) and aphid stress (blue). RT=12.3 min = lutein; RT=14.1 min = chlorophyll; RT=15.0 min = pheophytin; RT=17.6 min = b-carotene. NS is a nonsignificant difference, and *P ≤ 0.05, **P ≤ 0.01.