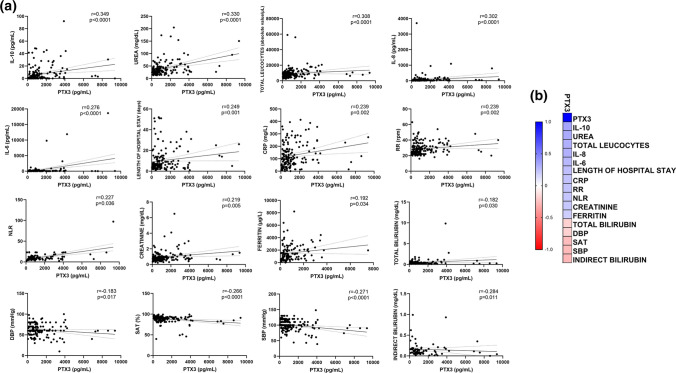
Fig. 2.
Relationship between plasma levels of PTX3 (pg/mL) and the continuous variables included in the study. A A linear regression line shows the relationship between plasma levels of PTX3 and continuous variables. The spline chart demonstrates the mean with 95% confidence intervals. B Heat map representing the degree of correlation between PTX-3 levels and the variables analyzed. The degree of correlation was assessed using Spearman’s rank correlation coefficient test. Significance was considered when p < 0.05. CRP: C-reactive protein; DBP: diastolic blood pressure; IL: interleukin; mmHg, millimeters of mercury; NLR: neutrophil-to-lymphocyte ratio; RPM: respirations per minute; RR: respiratory rate; SAT: lower oxygen saturation; SBP: systolic blood pressure

