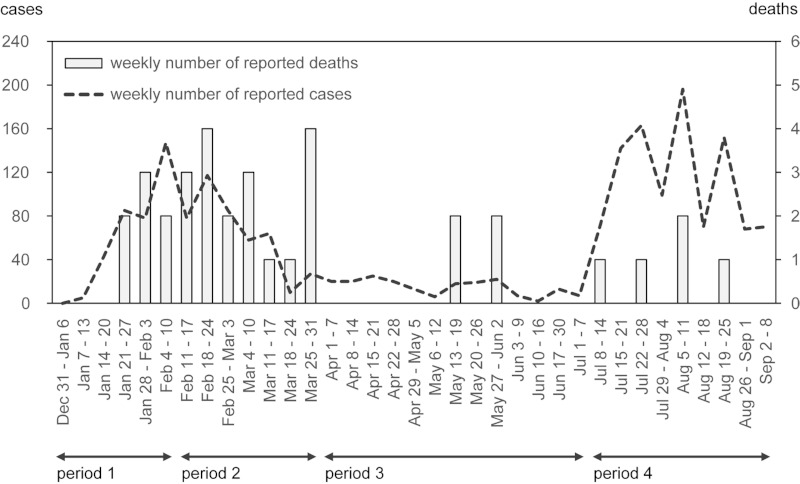
Figure 2.

Weekly new positive cases and deaths in patients on dialysis from January to early September 2022 in Tokyo. The weekly number of reported deaths (bar) and new positive cases (dotted line) is shown from the beginning of the first Omicron surge to the second surge. The temporary medical facility with the dialysis center started admitting patients on dialysis on January 20, 2022 and the transportation scheme started on February 5, and they were subsequently announced on February 3 and 7. Four periods for calculating the case fatality ratio are indicated. Data were derived from weekly cumulative data released by the Task Force Committee. The number of weekly new positives (deaths) was calculated by comparing the cumulative numbers of positives (deaths) in consecutive weeks.
