
FIGURE 7.
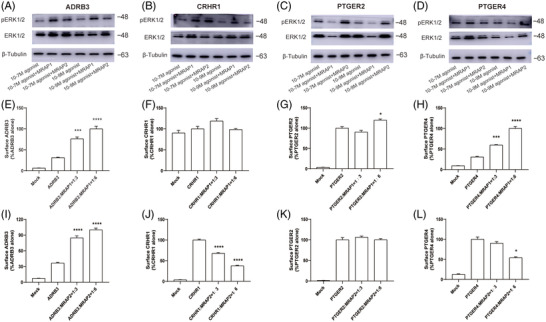
ERK signalling and surface expression of GPCRs in the presence of MRAPs. (A–D) Western blot for ERK1/2 and pERK1/2, and Tubulin was used as reference control. The samples order from left to right were: GPCR only (with 10‐7 M agonist), GPCR+MRAP1 (with 10‐7 M agonist), GPCR+MRAP2 (with 10‐7 M agonist), GPCR only (with 10‐9 M agonist), GPCR+MRAP1 (with 10‐9 M agonist), GPCR+MRAP2 (with 10‐9 M agonist). (E–L) Surface expression of selected GPCRs in HEK293 cells transfected with empty vector, MRAP1 or MRAP2 at 1:3 and 1:6 ratio using cell ELISA assays. One‐way ANOVA with post hoc Turkey test. ns, no significant change; *p < .05, **p < .01, ***p < .001, ****p < .0001. ELISA results of other GPCRs are shown in Figure S9. Each data column represents the mean ± SEM of three replicates (n = 3).