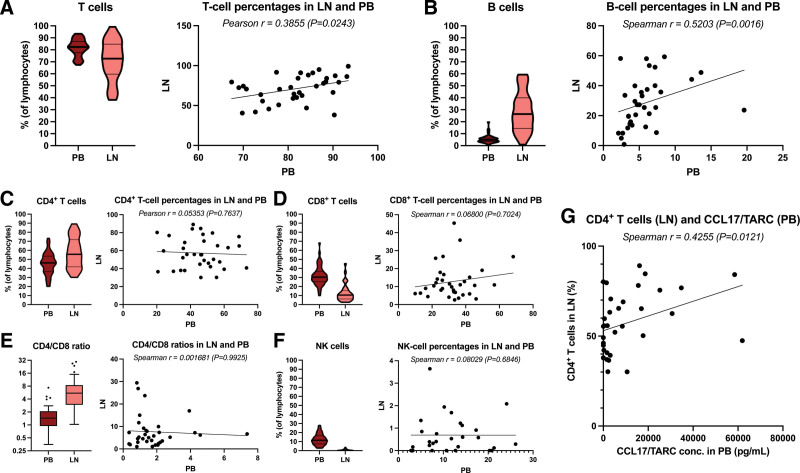
Figure 2.
Lymphocyte subset frequencies in PB and LN and correlations between the 2 compartments in cHL patients before primary treatment. (A) The percentage of T cells in PB and LNs and the correlation between these. (B) The percentage of B cells in PB and LNs and the correlation between these. (C) The percentage of CD4+ T cells in PB and LNs and the correlation between these. (D) The percentage of CD8+ T cells in PB and LNs and the correlation between these. (E) The CD4/CD8 ratio in PB and LNs and the correlation between these. (F) The percentage of NK cells in PB and LNs and the correlation between these. (G) Correlation between the concentration of CCL17/TARC in the PB and the percentage of CD4+ T cells in the LNs. The CD4/CD8 ratio data are depicted as box and whiskers plots in the style of Tukey. Percentages are depicted as violin plots with a thick line at the median and thin lines at the quartiles. Correlations are visualized by scatter plots with a simple linear regression line. cHL = classical Hodgkin lymphoma; LN = lymph node; NK = natural killer; PB = peripheral blood.

