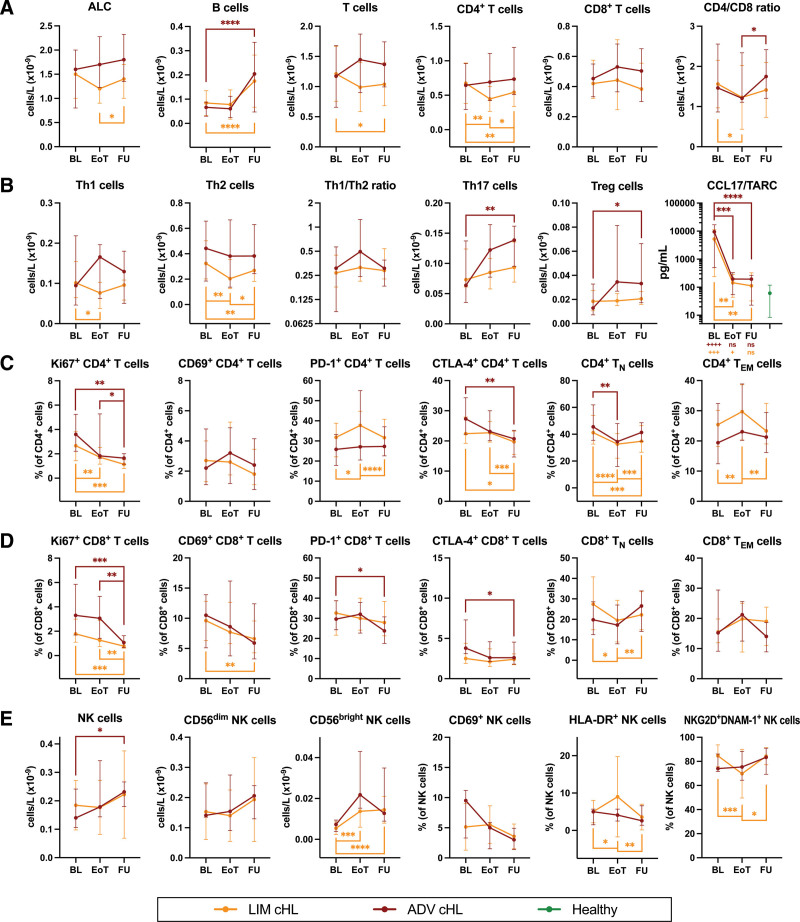
Figure 4.
Follow-up of lymphocyte numbers, subset frequencies, and functional characteristics in cHL patients at the end of standard primary treatment and 6 months later. Comparing limited-stage cHL patients at baseline (n = 27) to EoT (n = 25) and FU (n = 25), and advanced-stage cHL patients at baseline (n = 15) to EoT (n = 12) and FU (n = 14). (A) Absolute lymphocyte count (ALC) and absolute numbers of major lymphocyte populations (B cells, T cells, CD4+ T cells, CD8+ T cells, and CD4/CD8 ratio before and after treatment). (B) Percentages of CD4+ T cells that are expressing functional markers (Ki67, CD69, PD-1, and CTLA-4) before and after treatment. (C) The concentration of CCL17/TARC in plasma before and after treatment. Data are depicted as connected dots that indicate the median with error bars that indicate the interquartile range. Plus signs illustrate the P-value of Mann-Whitney tests comparing the respective time points with controls. (D) Percentages of CD8+ T cells that are expressing functional markers (Ki67, CD69, PD-1, and CTLA-4) before and after treatment. (E) Absolute numbers of NK cells, CD56bright NK cells, CD56dim NK cells, and NK cells that are expressing functional markers (CD69, HLA-DR, NKG2D, and DNAM-1) before and after treatment. Paired data are depicted as connected dots that indicate the median with error bars that indicate the interquartile range. Stars indicate the P-value of a Wilcoxon test comparing the indicated time points. *P < 0.05; **P < 0.01; ***P < 0.001; ****P < 0.0001. ADV = advanced-stage; BL = baseline; cHL = classical Hodgkin lymphoma; CTLA = cytotoxic T lymphocyte antigen; DNAM = DNAX accessory molecule; EoT = end of treatment; FU = follow-up 6 months after EoT; LIM = limited-stage; NK = natural killer; NKG2D = NK group 2 member D.

