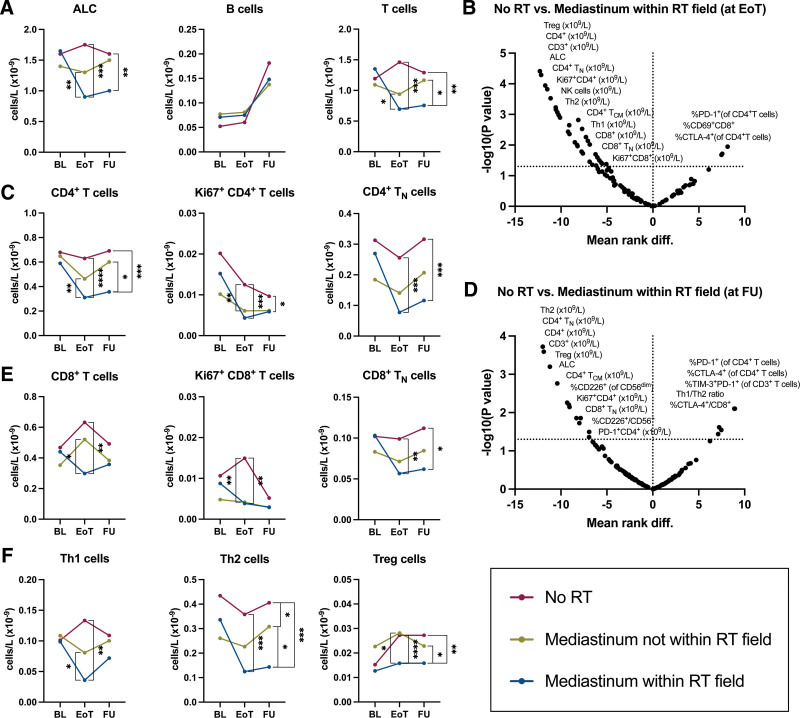
Figure 6.
Longitudinal comparison of ALC and T-cell numbers between cHL patients treated with and without RT. Absolute numbers of lymphocyte subsets before and after treatment that did not include RT (No RT; red dots and line), treatment that included RT where the mediastinum was not within the RT field (yellow dots and line), and treatment that included RT where the mediastinum was within the RT field. (A) ALC and absolute numbers of B cells and T cells. (B) Multiple comparisons between No RT (n = 22) and Mediastinum within RT field (n = 12) at EoT. (C) Absolute numbers of CD4+ T cells and selected subpopulations. (D) Multiple comparisons between No RT (n = 22) and Mediastinum within RT field (n = 12) at FU. (E) Absolute numbers of CD8+ T cells and selected subpopulations. (F) Absolute numbers of T helper subsets (Th1, Th2, and Treg). Paired data are depicted as connected dots that indicate the median without error bars. Multiple comparisons are depicted as volcano plots of multiple Mann-Whitney tests with a P-value threshold of 0.05 and without correction for multiple comparisons. The y-axis depicts the negative log10-transformed P values, so dots that are plotted above the horizontal line have a P value that is <0.05. The x-axis show the mean rank difference between the 2 indicated groups. A positive x-value means that the difference is in favor of the latter group in the graph title. Stars indicate the P-value of a Mann-Whitney test comparing the indicated groups at the indicated time point. *P < 0.05; **P < 0.01; ***P < 0.001; ****P < 0.0001. ALC = absolute lymphocyte count; BL = baseline; cHL = classical Hodgkin lymphoma; EoT = end of treatment; FU = follow-up 6 months after EoT; RT = radiotherapy.

