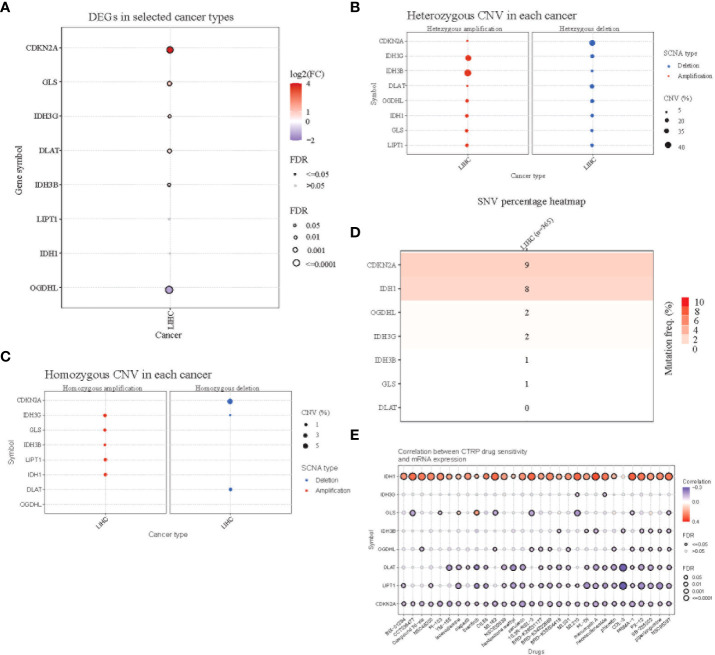
Figure 2.
Mutation analysis of the 8-gene signature. (A) Differential expression of the eight genes in TCGA HCC tissues and normal adjacent tissues. Red(log2FC>1) indicates high expression, while blue indicates low expression. (B) Homozygous copy number variation of the eight genes in the TCGA HCC cohort. Amplifications are shown on the left and deletions are shown on the right. (C) Heterozygous copy number variation of the eight genes in the TCGA HCC cohort. (D) Single nucleotide variant (SNV) variation of the eight genes in the TCGA HCC cohort. (E) Correlation analysis of the expression of the eight genes and drug sensitivity using the CTRP database.

