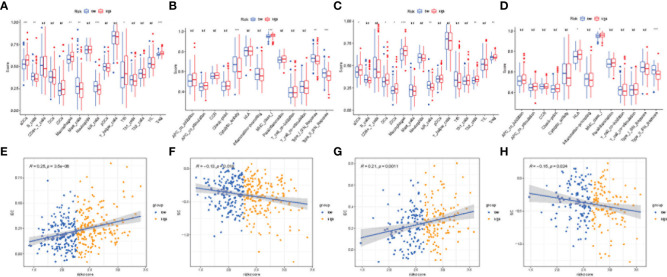
Figure 8.
Immune microenvironment and immunophenoscore analyses. Box plots showing immune cell infiltration fraction and immune function activity in TCGA (A, B) and ICGC (C, D) cohorts. Correlation plot for effector cell (EC) score and risk score in TGCA (E) and ICGC (F) cohorts. Correlation plot for immunosuppressive cell (SC) score and risk score in TCGA (G) and ICGC (H) cohorts. (***p < 0.001, **p < 0.05, *p < 0.1, ns, no significance).

