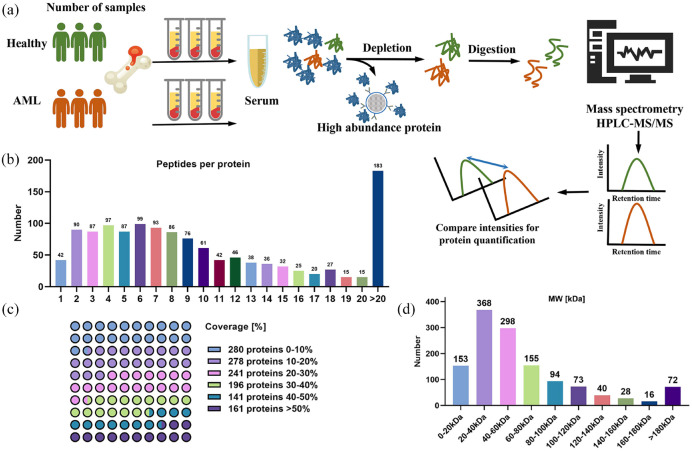
Figure 1.
Proteomic analysis of serum from bone marrow in normal and AML patients. (a) Schematic of general protein quantitation by mass spectrometry. Healthy, n = 3; AML, n = 10. (b) Most proteins correspond to more than two peptides, and multiple specific peptides for each protein can increase the accuracy and reliability of quantitative results. (c) Percentage of protein coverage by the identified peptides. (d) Distribution of proteins of different molecular weights.

