Figure 2.
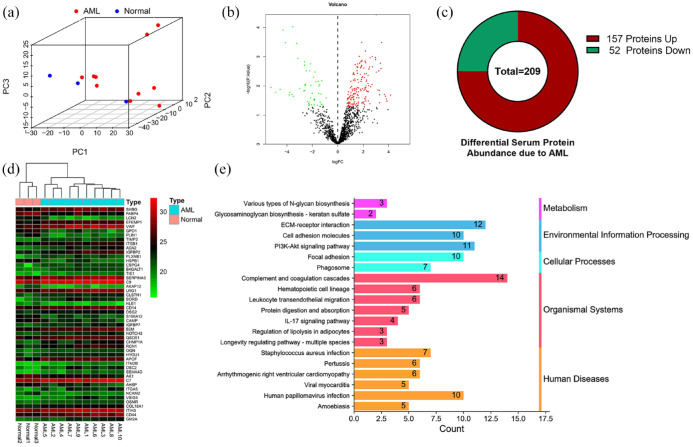
Proteomics analysis reveals differential protein expression in the bone marrow of AML patients. (a) Principal component analysis (PCA) showed a correlation between bone marrow serum proteomics data of healthy subjects and AML patients. (b) Volcano plots for expression of differentially expressed proteins, red and green separately represent upregulation and down-regulation. (c) A total of 157 upregulated proteins and 52 downregulated proteins were identified. (d) The heat map shows the top 50 differential proteins with significant changes. (e) The bar chart details the number of related proteins that are significantly altered in a particular pathway.

