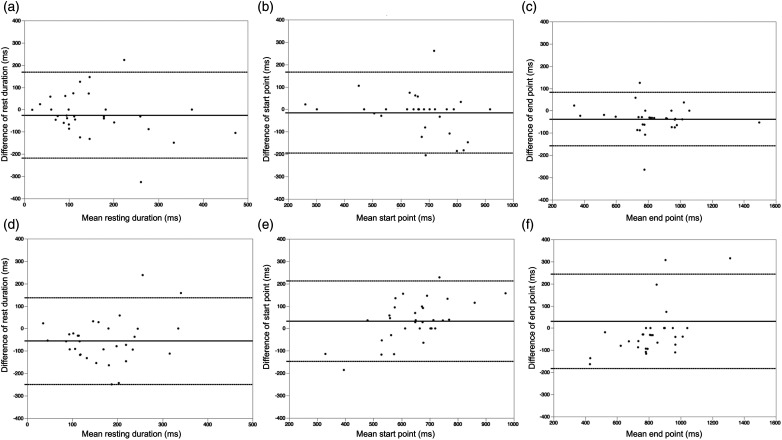
Figure 4.
Bland–Altman plot analysis. The Bland–Altman plots of the resting phase for neural networks and manual detection. The mean bias (solid line) and 95% confidence intervals (dotted lines) are shown. (A) Rest duration between the neural network and manual detection by experts. (B) Start point between the neural network and manual detection by the expert. (C) End point between the neural network and manual detection by the expert. (D) Rest duration between manual detection by the general operator and expert. (E) Start point between manual detection by the general operator and expert. (F) End point between manual detection by the general operator and expert.

