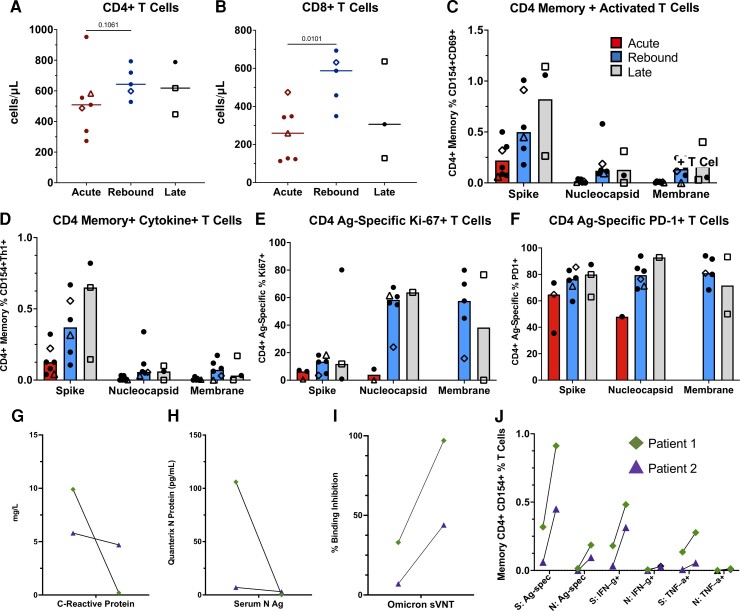
Figure 4.
Comparison of CD4+ T-cell responses across the groups and longitudinal immune responses of the 2 patients with sampling at acute and rebound time points. Absolute T-cell counts compared across groups (A, B). Lines represent median values and points represent individual results. The 2 longitudinal patients are identified by an open triangle and open diamond. The empty square represents the coronavirus disease 2019 rebound patient who did not receive nirmatrelvir-ritonavir. T-cell subset flow cytometry data not available for longitudinal patient 2 (triangle) at rebound time point. T-cell stimulations were performed with peptide pools corresponding to spike, nucleocapsid, and membrane proteins as listed on the x-axis. Bars represent medians and groups are defined as acute, rebound, and late presentations. Severe acute respiratory syndrome coronavirus 2–specific CD4 T-cell responses are highlighted by memory (C), cytokine-producing (CD154 + IFN-γ+, CD154 + TNF-α+ or CD154 + IL-2+) (D), activated (CD154 + CD69+) (E), or Ag-specific proliferating (Ki-67+) and activated (PD-1+) T cells (F). For phenotyping of Ki-67 + and PD-1+ cells, a threshold of at least 20 events and a 2-fold increase over unstimulated cells was used, and samples were excluded if they did not meet these thresholds (E, F). Serum N Ag and C-reactive protein trends from the 2 longitudinal patients (G, H). T-cell responses and neutralizing antibodies from the acute and rebound presentation for 2 patients with longitudinal samples (I, J). T-cell responses are from S and N stimulations. Ag-specific CD4 T cells defined by (CD154 + CD69+, CD154 + IFN-γ+ and CD154 + TNF-α+), and neutralizing antibodies represented by percent binding inhibition on the sVNT. Abbreviations: Ag, antigen; S, spike; N, nucleocapsid; spec, specific; sVNT, surrogate virus neutralization test.

