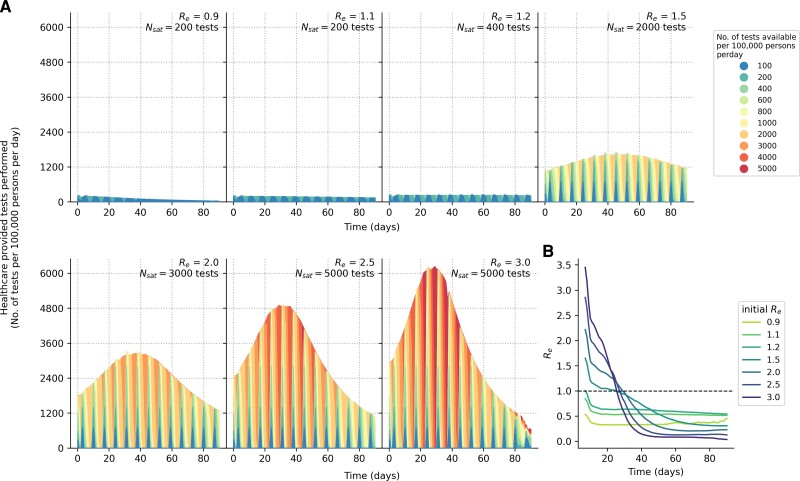
Figure 4.
Symptomatic testing demand during an epidemic (without quarantine of household members). A, Number of symptomatic tests performed per 100 000 persons per day over time for different Re values. Each differently colored shaded curve denotes a different number of tests available per 100 000 persons per day. We assumed that all healthcare facilities in the community will have new stocks of 1 week's worth of Ag-RDTs every Monday. The symptomatic testing demand includes both symptomatic individuals with SARS-CoV-2 who seek testing at healthcare facilities and those who seek symptomatic testing for other reasons based on assumed case positivity rates (see Methods section). The area between the curve plotting the testing rate needed to saturate symptomatic testing demand (Nsat) and the curve for testing rate <Nsat is the amount of symptomatic testing shortage accumulated over time between those 2 testing rates. B, Seven-day moving average of time-varying effective reproduction number (Re) over a simulated epidemic period (90 days) assuming that testing demand is fully satisfied. Abbreviations: Ag-RDT, antigen rapid diagnostic test; SARS-CoV-2, severe acute respiratory syndrome coronavirus 2.

