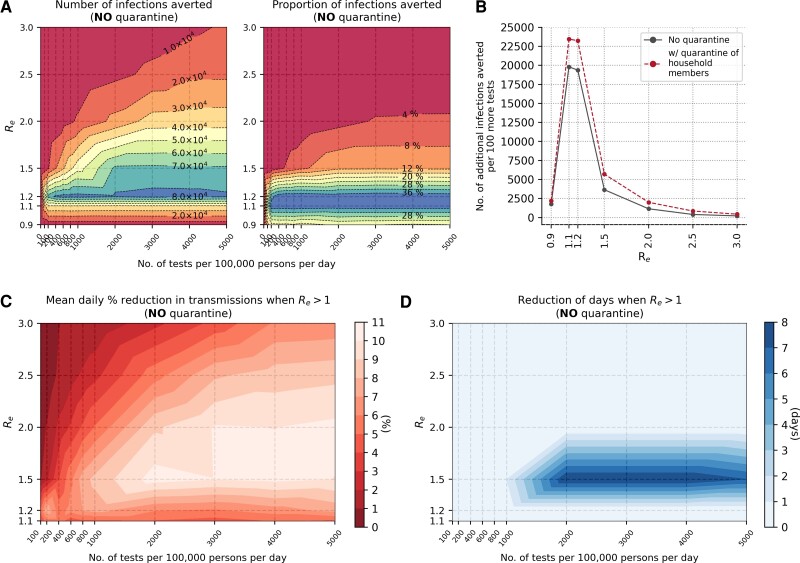
Figure 5.
Marginal impact of symptomatic testing prior to saturating demand (without quarantine of household members). A, Contour plots depicting infections averted relative to the no-testing baseline for simulations with different Re values and varying number of Ag-RDT availability. Left panel: Number of infections averted relative to the no-testing baseline after 90 days. Right panel: Proportion of secondary infections averted relative to the no-testing baseline after 90 days. B, Number of additional infections averted for every 100 more Ag-RDTs available prior to saturating symptomatic testing demand for different Re values. The dashed line shows a marginal benefit with quarantine of household members while the solid black line depicts that without quarantine. C, Mean daily percentage reduction in transmissions while time-varying Re of simulated epidemic is still >1 for different initial Re values and varying number of Ag-RDTs available for symptomatic testing only. D, Reduction in number of days when time-varying Re of simulated epidemic is >1 for different initial Re values and varying number of Ag-RDTs available for symptomatic testing only. Abbreviation: Ag-RDT, antigen rapid diagnostic test.

