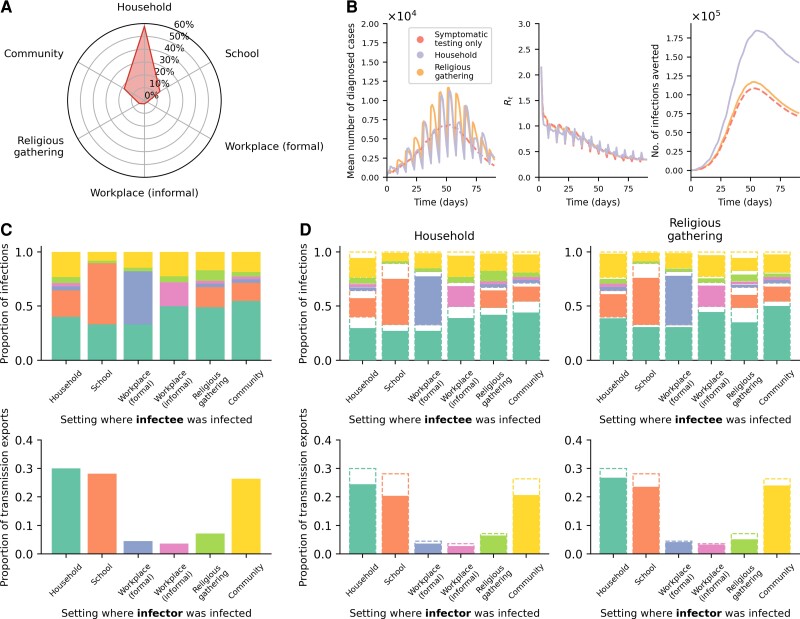
Figure 7.
Routine community testing in households outperforms other settings. A, Average breakdown of infections based on the social setting where transmissions occurred for the simulations presented in this work. B, Results from simulations using different testing strategies where Re = 1.5, no quarantine of household members of positively tested individuals assumed, and Ag-RDT availability of 5000 tests per 100 000 persons per day. Community testing (even distribution) was performed with a symptomatic-testing-first approach. The mean total number of diagnosed cases (left), time-varying reproduction number (Re; middle), and number of infections averted (right) over the epidemic period are plotted. C, D, Transmissions across distinct social settings. The top row of stacked plots shows the proportion of infections stratified by the source settings where infectors were infected for each sink setting where their infectees were infected. The stacked bars are colored by the source settings as per the bottom row of bar plots. The bottom row of bar plots shows the contribution of transmission exports into other settings (ie, transmission events where the infectees were infected in a setting that is different from their infectors) from different source settings where the infectors were infected. C, The no-testing baseline results from the example case as in panel B. D, Results from either implementing a symptomatic-testing-first community testing in households (left panels) or religious gathering (right panels). The dashed bar outlines are the no-testing baseline results as in panel C. Abbreviation: Ag-RDT, antigen rapid diagnostic test.

