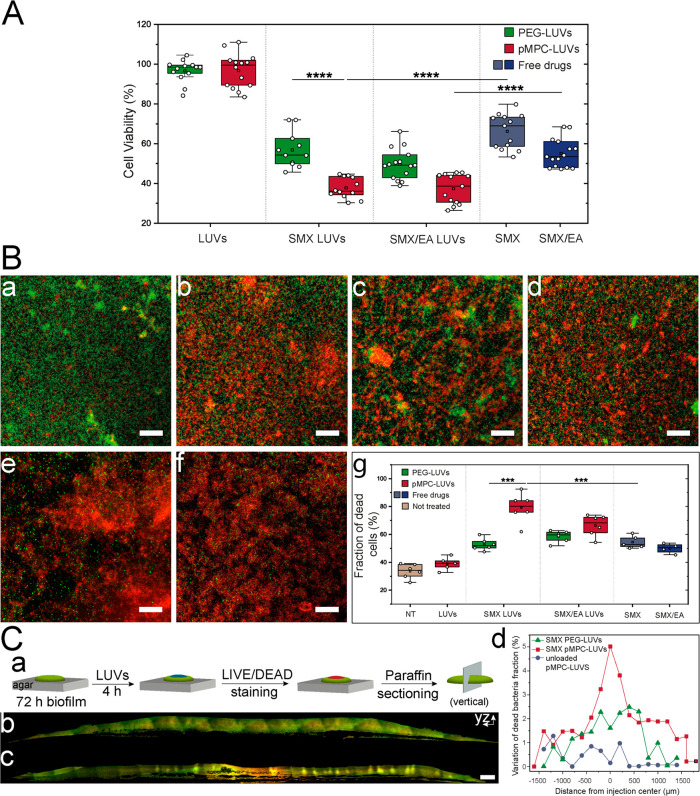
Figure 6.
Effect of SMX and SMX/EA-LUVs on biofilm viability. (A) PA14-cell viability after two-dose treatment (4h each) with SMX- and SMX/EA- LUVs and free drugs quantified by MBEC-based resazurin assay. Blue boxes (SMX [1.5 mg/mL], SMX/EA [0.7/1.5 mg/mL]) represent treatment with free drugs. Data obtained from 8 or more biological repeats. (B(a–g)) Representative confocal microscopy images of the antibacterial effect of drug-loaded LUVs and free drugs on 24 h biofilm evaluated by a live (green)/dead (red) assay. Images show representative areas from chamber slides. (a) nontreated (NT) biofilm; (b) free SMX [1.5 mg/mL]; (c) SMX-loaded PEG-LUVs; (d) SMX/EA-loaded PEG-LUVs; (e) SMX/EA-loaded pMPC-LUVs; (f) SMX-loaded pMPC-LUVs. Scale bar, 50 μm. (g) Percentage of dead bacteria quantified from at least four different microscopic images. Data represent a minimum of two biological repeats with two technical repeats each. (C(a–d)): Confocal microscopy of cross sections of paraffin-embedded PA14-colony after 4h treatment with pMPC-LUVs loaded with SMX. (a) Preparation of a 10 μm-thin section of the colony upon treatment with (b) 5 μL unloaded pMPC-LUVs or (c) 5 μL pMPC-LUVs loaded with SMX. Live (green)/dead (red) staining was applied prior to fixation. Scale bar, 100 μm. (d) Spatial profiles for biofilm sections displaying variation in dead bacteria cells fraction upon injection with either SMX-loaded pMPC-LUVs (red) or PEG-LUVs (green), or nonloaded liposomes (blue). Details of the quantification in the Methods sections and Figure S15. Differences between groups shown in box plots were tested with a one-way ANOVA. Boxes represent the 25–75 percentiles of the sample distribution, with black vertical lines representing the 1.5 × IQR. Black horizontal line represents the median.

