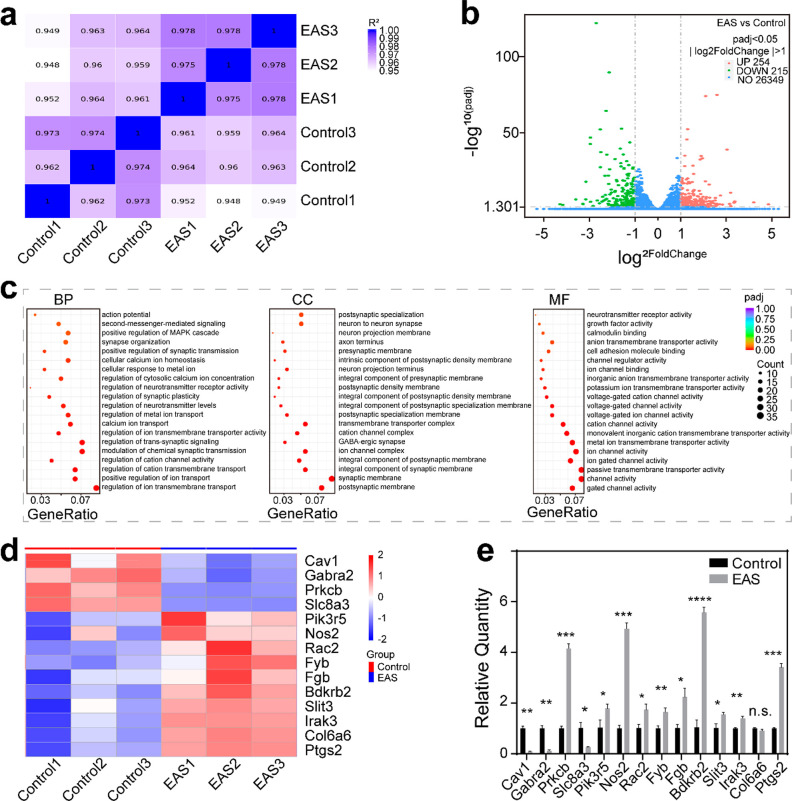
Figure 6.
Differential gene analysis of SGNs in the control and EAS groups. (a) Heat map showing the gene expression level correlation between samples. The values were the squares of the correlation coefficients. (b) Volcano plot of differentially expressed genes between the control group and the EAS group. The abscissa represent the change of gene expression multiple between the two groups (log2FoldChange), and the ordinate represents the significance level of the expression difference between the two groups (−log10PADj). |log2FoldChange| ≥ 1 and padj≤ 0.05 were the screening standards for differential genes. Up-regulated genes are shown as red dots (right), down-regulated genes are shown as green dots (left), and genes with no difference are shown as blue dots. (c) GO enrichment analysis. The abscissa is the gene ratio, and the ordinate is the 20 enrichment GO terms. The sizes of the dots represent the number of genes enriched, and the color represents the significance of enrichment. (d) Cluster heat maps of differentially expressed genes in the control group and the EAS group. The ordinate is the normalized value of the differential gene FPKM. The colors represent the expression level. (e) mRNA expression levels of genes in the cluster heat map. Data are presented as mean ± SD (*P < 0.05, **P < 0.01, ***P < 0.001, ****P < 0.0001)

