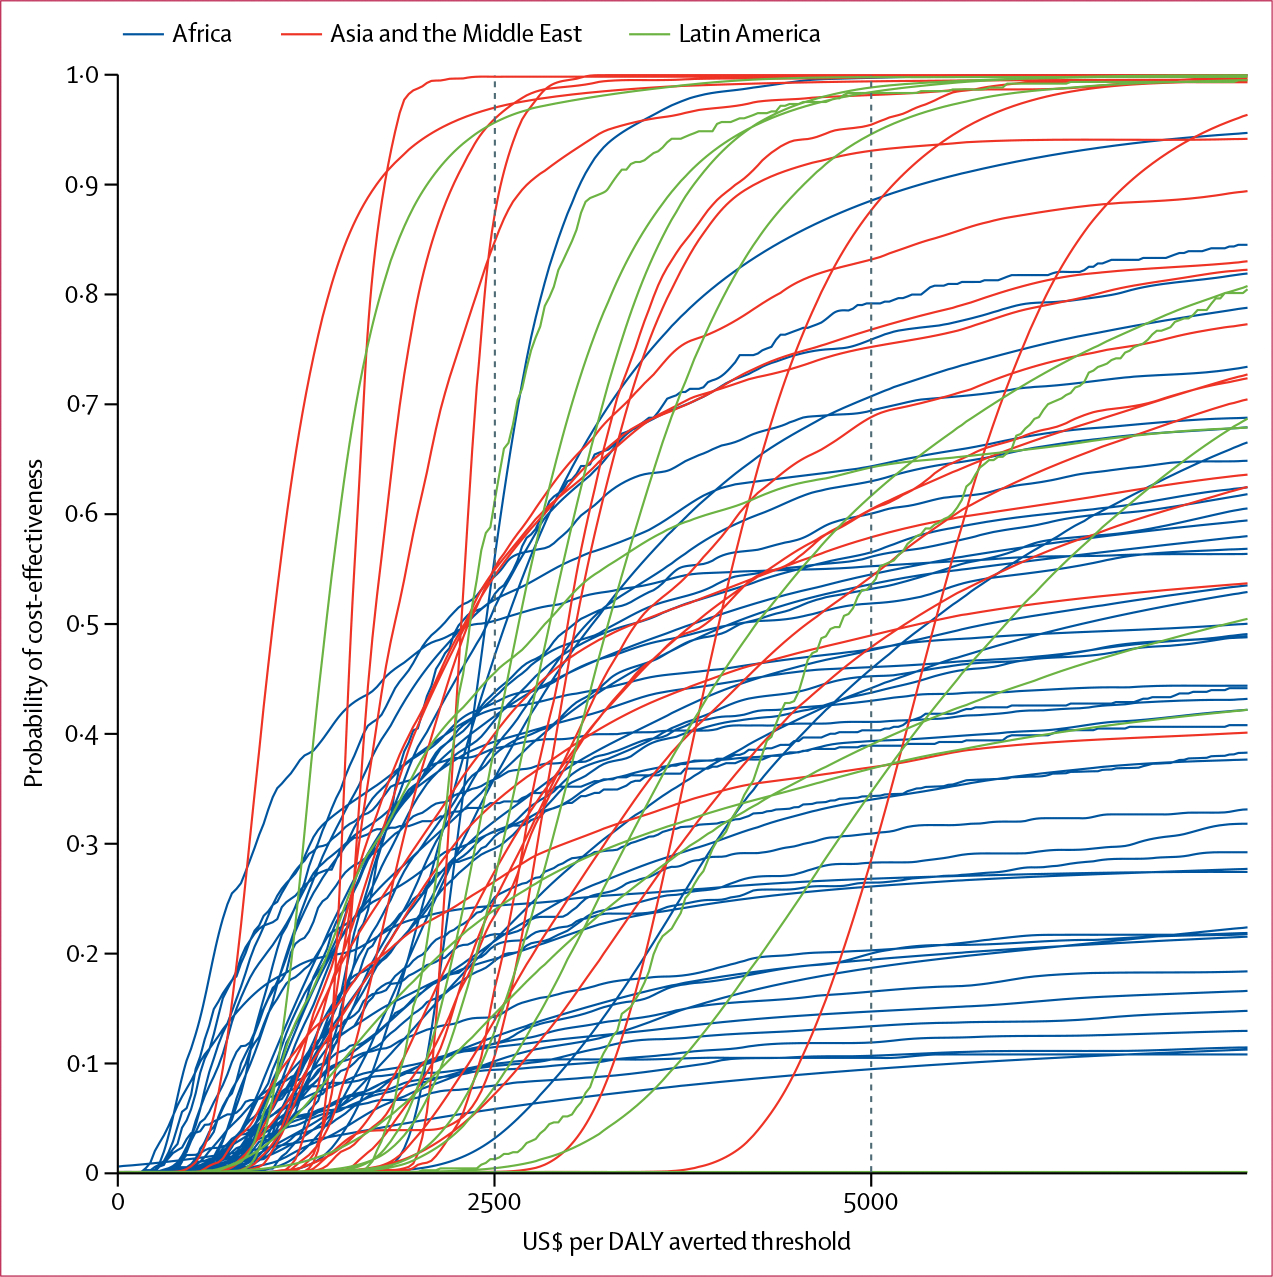
Figure 5: CEACs for countries in each region.

CEACs for each country in Africa, Asia and the Middle East, and Latin America. Each CEAC plot shows the proportion of simulations (y axis) where MNPs are cost-effective at a particular cost-effectiveness threshold value (x axis). Countries where the cumulative probability does not reach 1·0 are those in which the non-depicted simulations showed a net harm (and hence where cost-effectiveness could not be calculated). CEACs for each country are shown in the appendix (pp 120–22). CEAC=cost-effectiveness acceptability curve.
