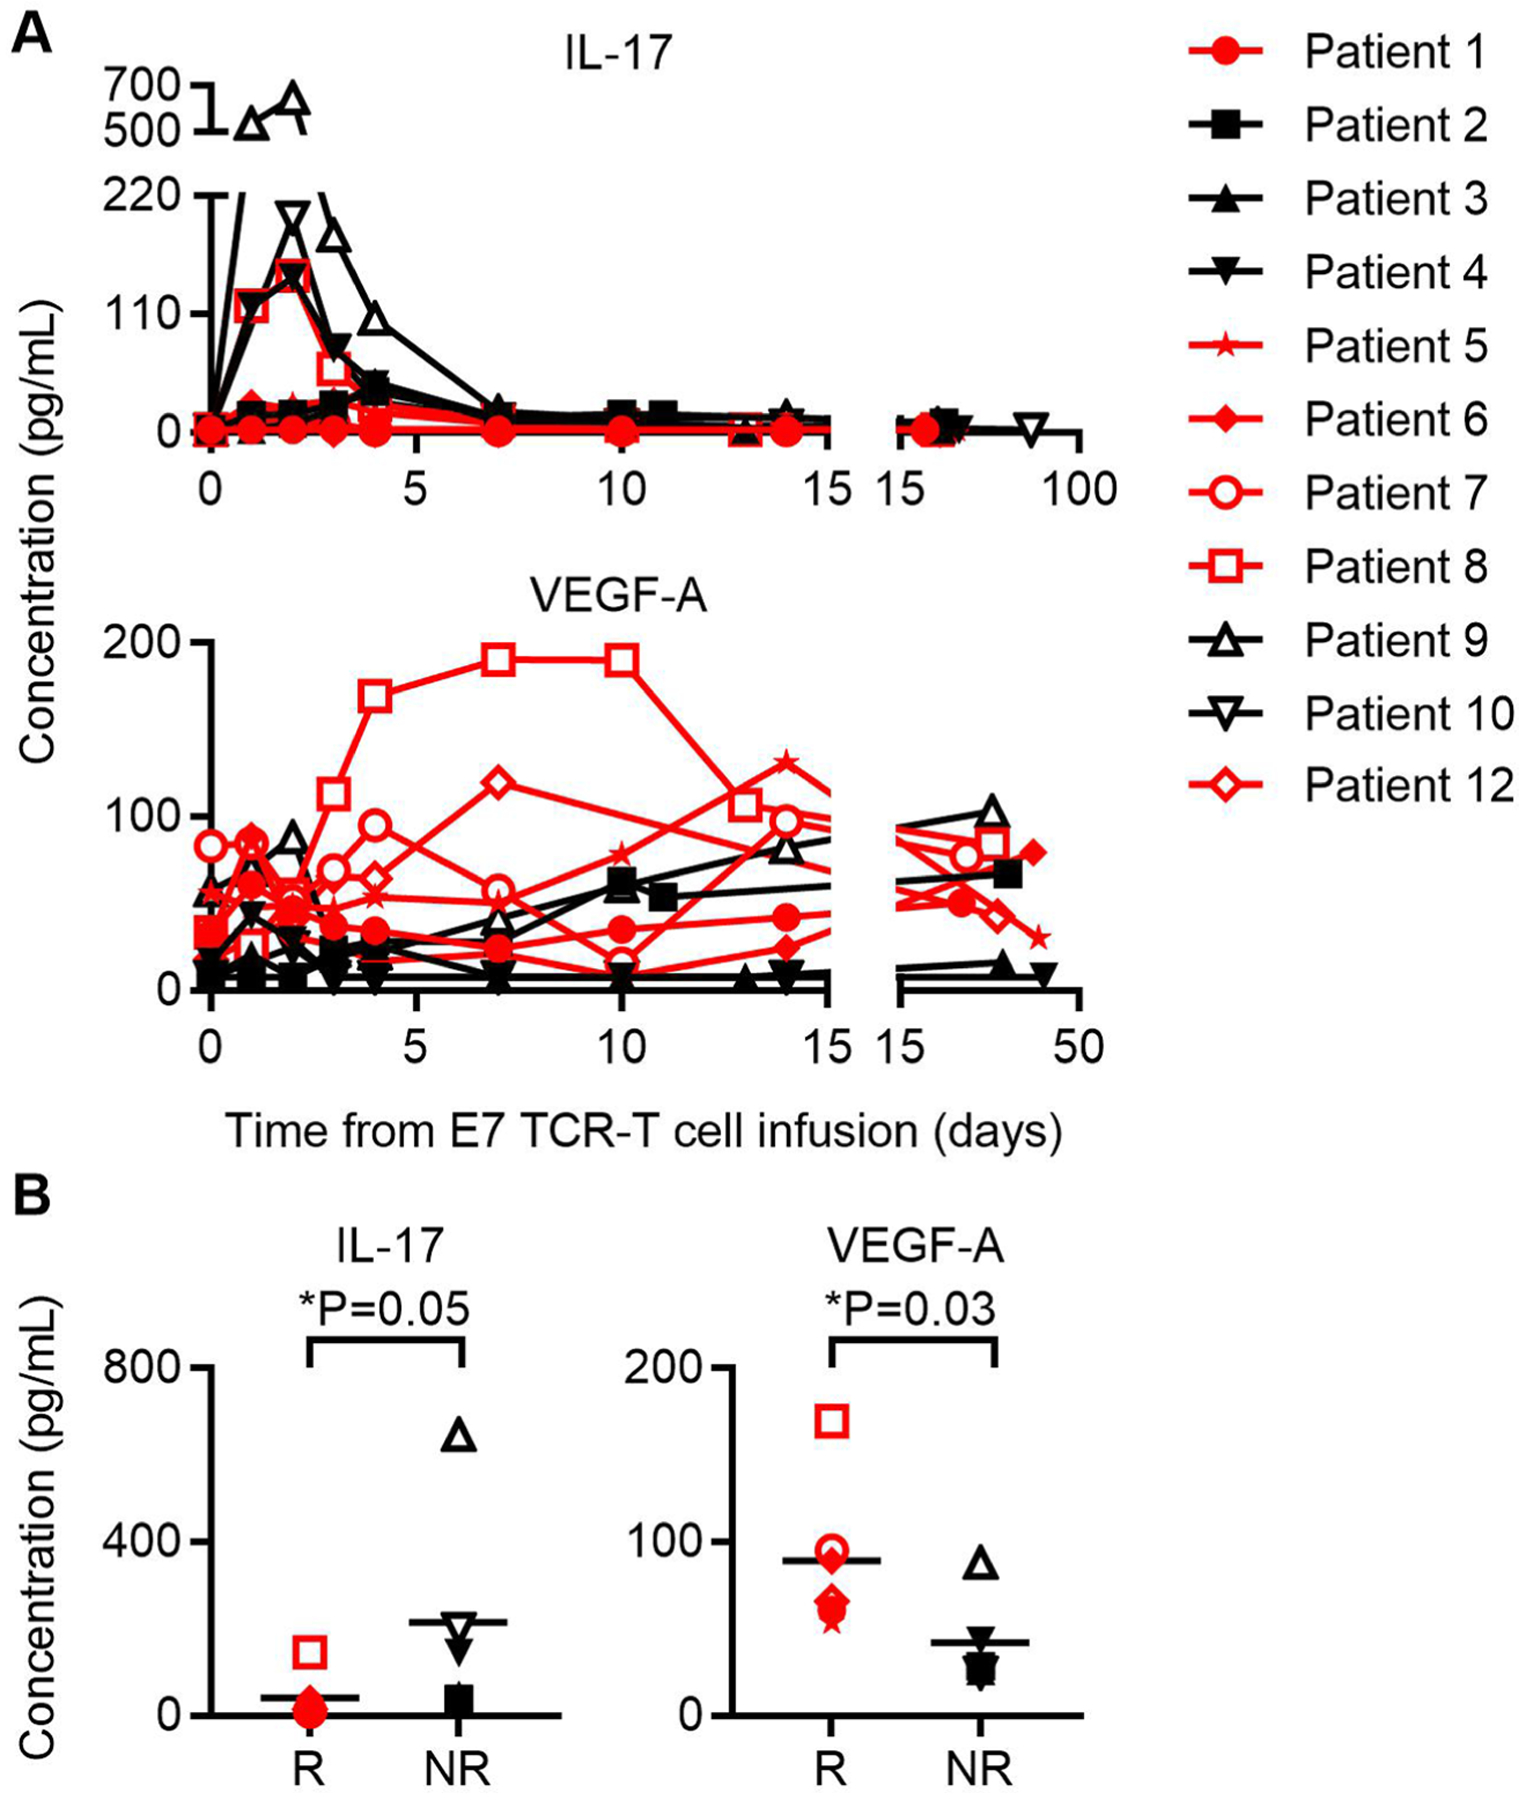
Extended Data Fig. 9 |. Serum cytokines and chemokines following E7 TCR-T cell infusion.

Serum concentrations of IL-1α, IL-1β, IL-4, IL-5, IL-6, IL-7, IL-8, IL-10, IL-12/23 p40, IL-12 p70, IL-13, IL-15, IL-16, IL-17A, IL-21, IL-22, IL-23, IL-27, IL-31, IFNγ, TNFα, TNFβ, GMCSF, VEGF-A, Eotaxin, Eotaxin-3, CXCL10, MCP-1, MCP-4, MIP-1α, MIP-1β, TARC, and MIP-3α were determined. Chemokines and cytokines for which the peak values were significantly different between responding and non-responding patients are shown. a, Graph of serum IL-17 and VEGF-A concentrations in patients indicated in symbol legend at the time points indicated on the x-axis. Red color indicates patients with tumor responses. b, Peak IL-17 and VEGF-A serum concentrations in patients who responded (R) or who did not respond (NR) to treatment. The symbol legend is shown in panel A. Statistical significance was determined by a two-sided unpaired t-test.
