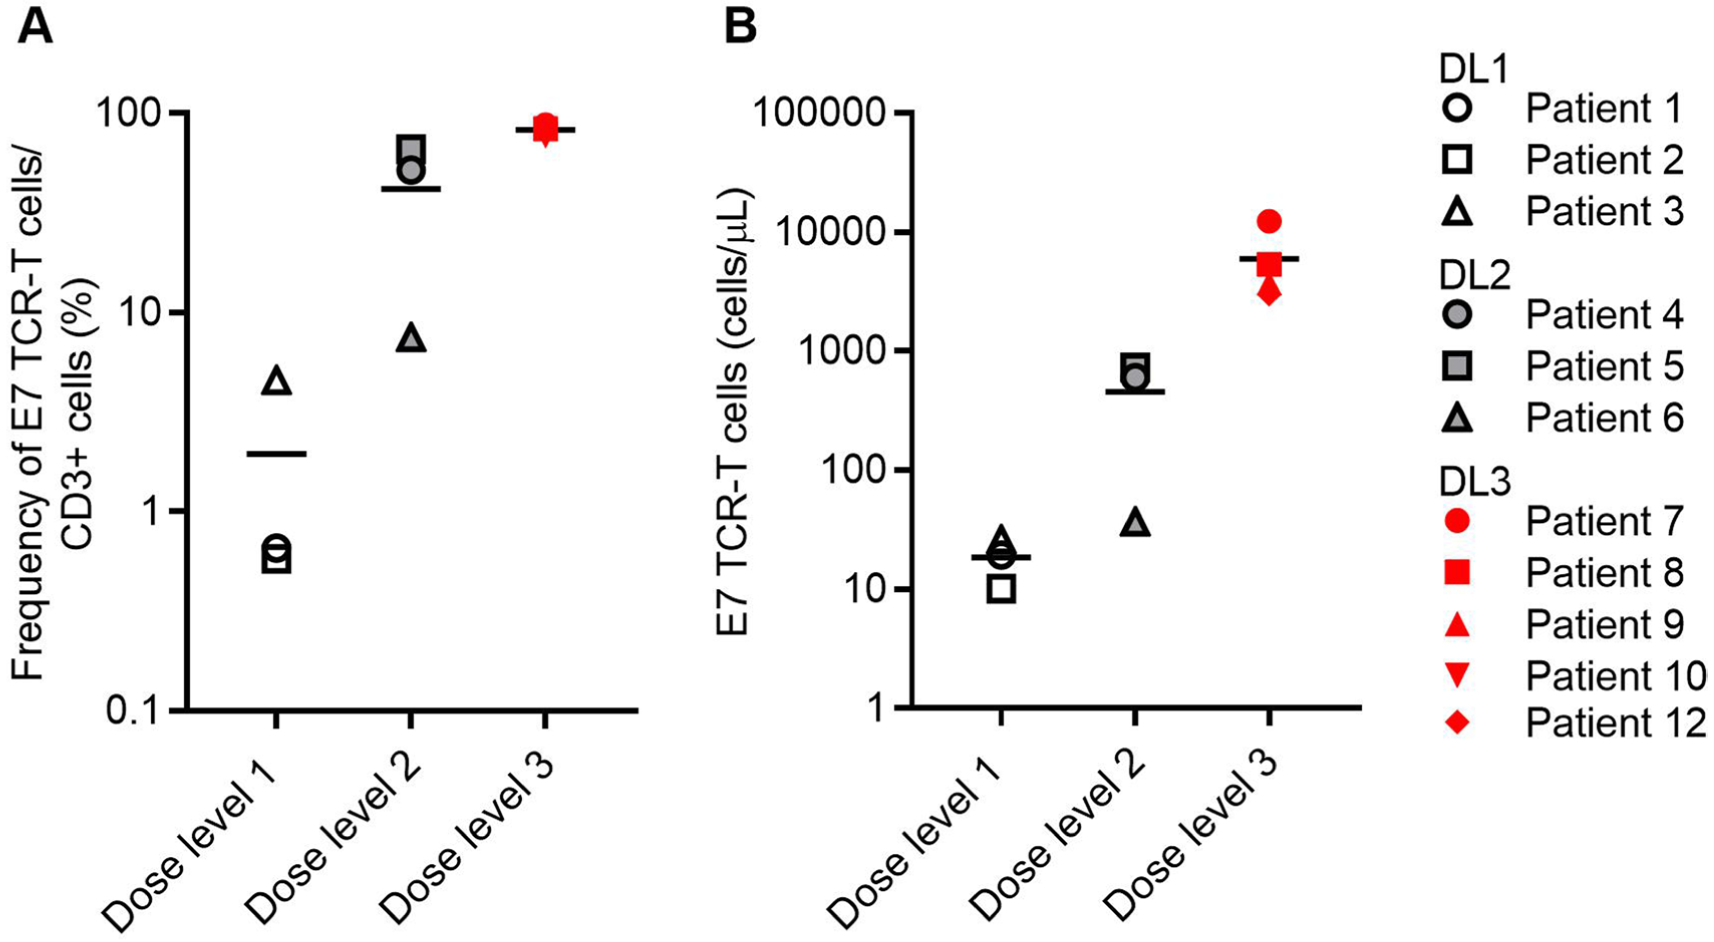
Extended Data Fig. 4 |. Peripheral blood engraftment of E7 TCR-T cells.

Flow cytometry was used to determine engraftment of E7 TCR-T cells in the peripheral blood of patients at the first response assessment timepoint (6 weeks). a, The frequency of E7 TCR-T cells in peripheral blood correlated with dose (P = 0.0006, Kruskal-Wallis one-way ANOVA) but not with response (P = 0.347, two-sided unpaired t-test). b, The concentration of E7 TCR-T cells in peripheral blood correlated with dose (P = 0.0226, one-way ANOVA) but not with response (P = 0.4796, two-sided unpaired t-test).
