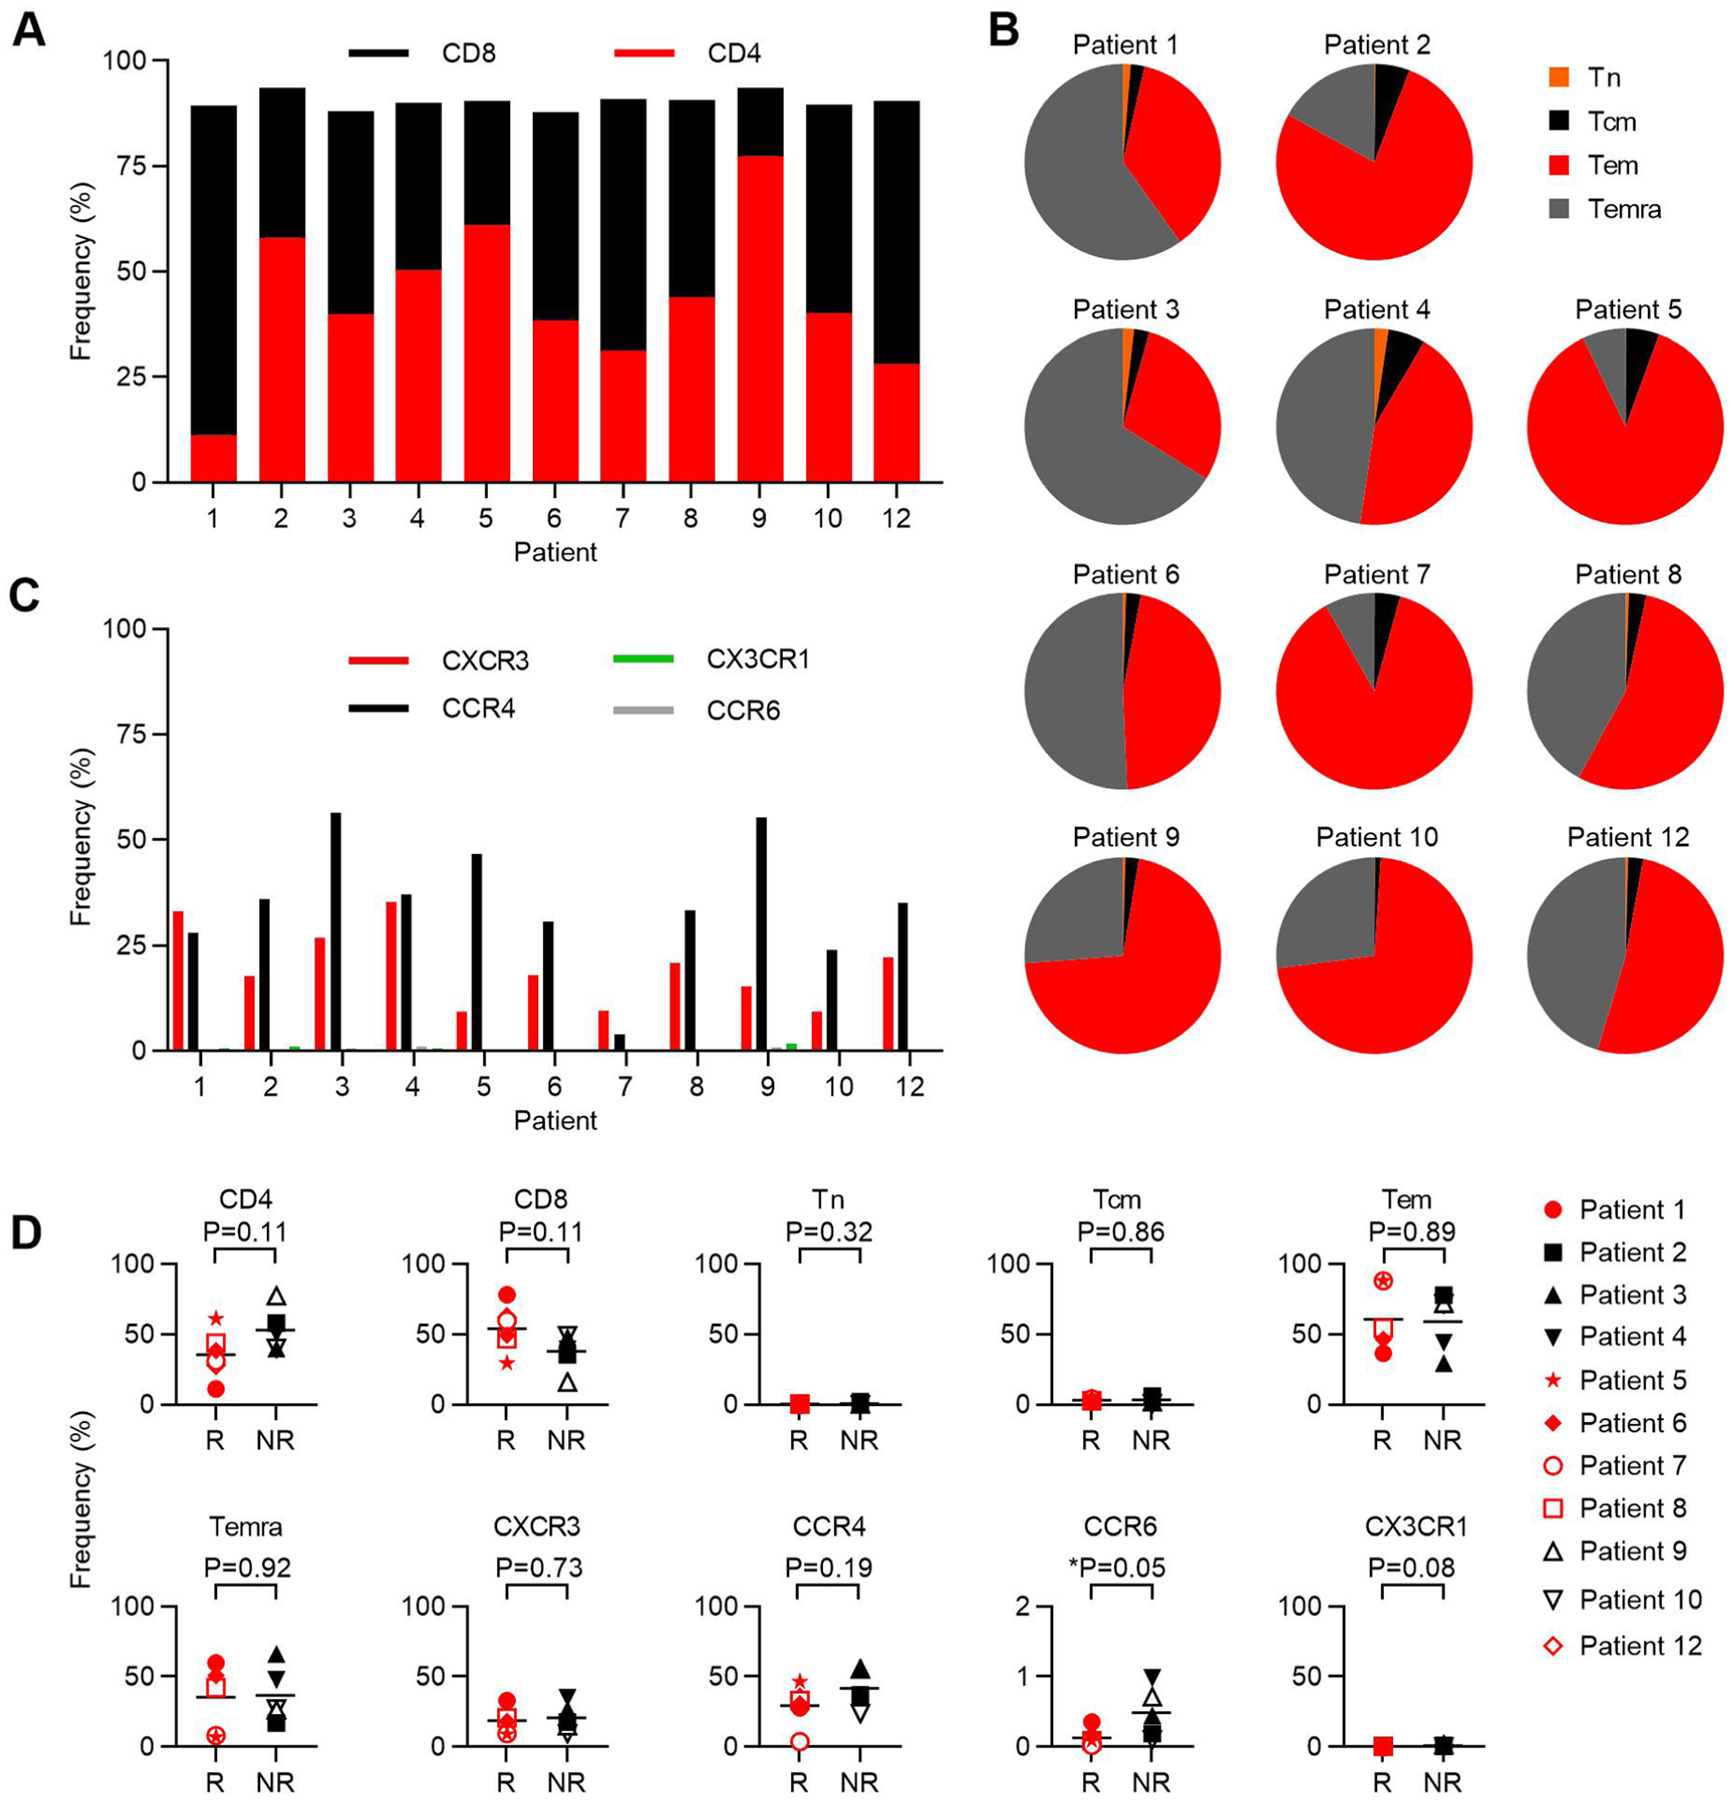
Extended Data Fig. 6 |. Infusion product phenotypic characterization.

The expression of cell surface antigens by E7 TCR-T cells was determined by flow cytometry. a, Stacked bar graph of the frequency of single-positive CD4 and CD8 T cells. b, Pie chart that depict memory T cell subset composition. Tn (naïve, CD45RA+CCR7+), Tcm (central memory, CD45RA−CCR7+), Tem (effector memory, CD45RA−CCR7−), Temra (effector memory RA+, CD45RA+CCR7−). c, Bar graph of the frequency of expression of the chemokine receptors in the symbol legend. d, The frequency of each marker or subset in the E7 TCR-T cells administered to patients who responded (R) or did not respond (NR) to treatment. P-values are two-sided unpaired t-tests.
