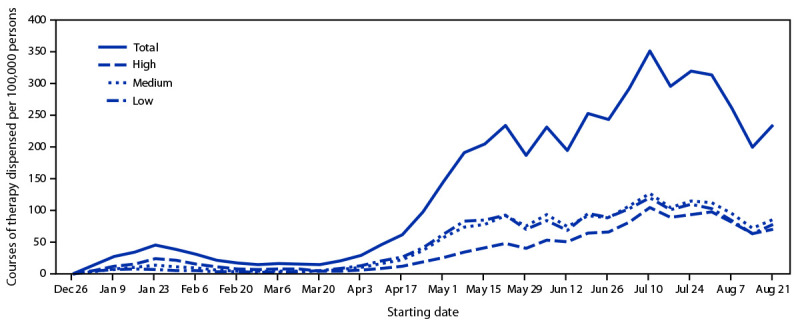
FIGURE.

Courses of oral antiviral COVID-19 therapy dispensed per 100,000 persons, by zip code–level social vulnerability — United States, December 23, 2021–August 28, 2022*
* Oral antivirals included nirmatrelvir/ritonavir (Paxlovid) (www.fda.gov/media/155050/download) and molnupiravir (Lagevrio) (www.fda.gov/media/155054/download). Zip codes were classified as having low, medium, or high social vulnerability based on ranking within the lower, middle, and upper tertiles of the Equitable Distribution Index score.
