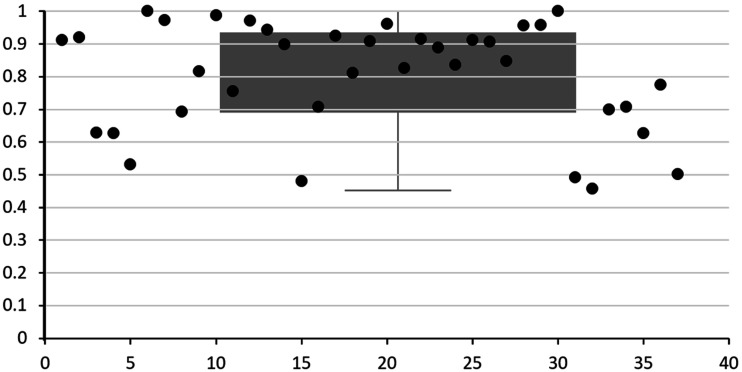
Figure 2.
Box and scatter plot of Tau-U effect sizes for single-case design studies.
The figure shows a box and whiskers plot and a scatter plot of the Tau-U effect sizes of all single-case design studies included in this review. The y-axis represents Tau-U effect sizes from 0 to 1 and the x-axis represent the numbered order of which the studies are displayed on the scatter plot. The numbered order of the studies can be found in Table 2.

