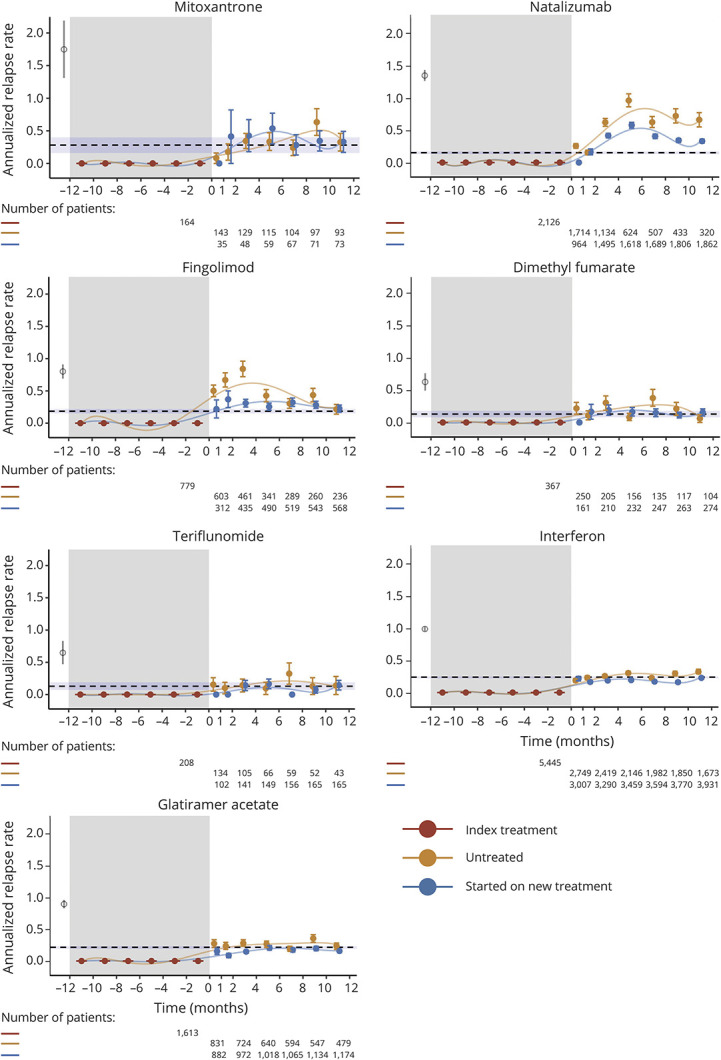
Figure 3. Annualized Relapse Rate in the 12 Months Before Baseline (During Index Treatment) and After Treatment Cessation in Patients Without Relapses in the Year Before Baseline.

Baseline (treatment cessation) is indicated by time point 0 and represents the last recorded date of medication administration. The period after treatment cessation is stratified by patients who remained untreated or have started a new treatment (for each 1- or 2-month period). The on-treatment period is indicated by the gray shaded area. Point and whiskers show the relapse rates in each epoch. Number of patients: patients who contribute some time to each period. The pretreatment relapse rate and 95% CI is indicated by the open circle and line. The relapse rate was calculated using up to 1 year of untreated time immediately before treatment start. The dashed black line is a visual reference of the mean relapse rate during the second year before treatment cessation, with the shaded area indicating 95% CIs. Only treated time was included.
