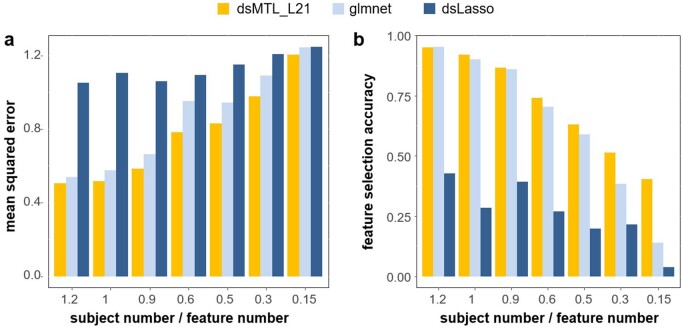
Fig. 2.
Analysis of ‘heterogeneous’ signatures of continuous outcomes in simulated data stored on three servers. The figure shows the: (a) prediction accuracy expressed as the mean squared error and (b) the feature selection accuracy for different subject/feature number ratios. The respective values were averaged across the three servers, and across 100 repetitions, in order to account for the effect of sampling variability

