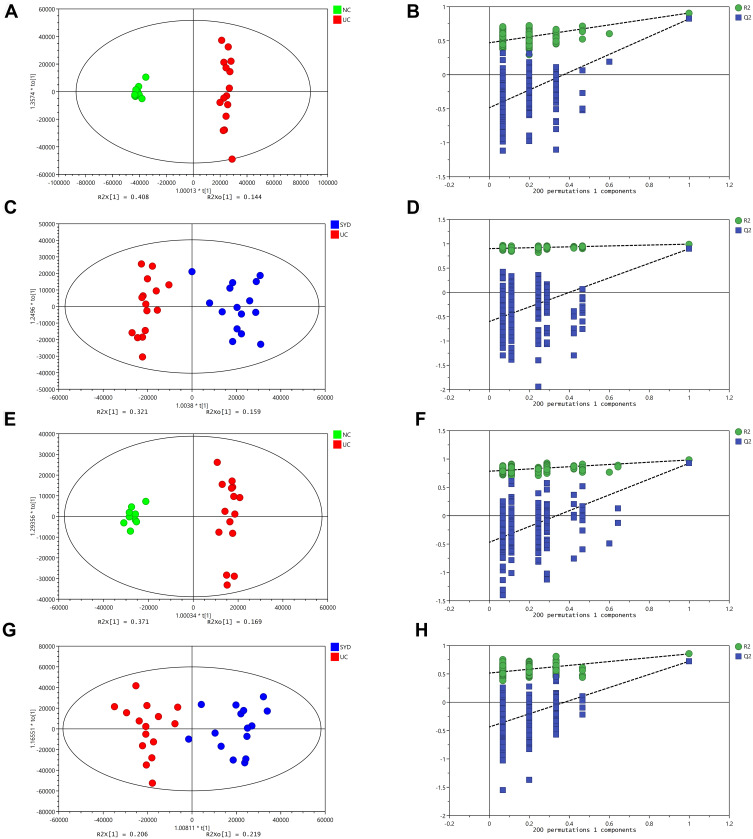
Figure 8.
Metabolite changes in fecal samples. (A and B) OPLS‐DA plot of the normal and model groups in positive mode. (C and D) OPLS‐DA plot of the SYD and model groups in positive mode. (E and F) OPLS‐DA plot of the normal and model groups in negative mode. (G and H) OPLS‐DA plot of the SYD and model groups in negative mode. (B, D, F and H) Validation of the corresponding OPLS‐DA model by the 200‐time permutation test.

