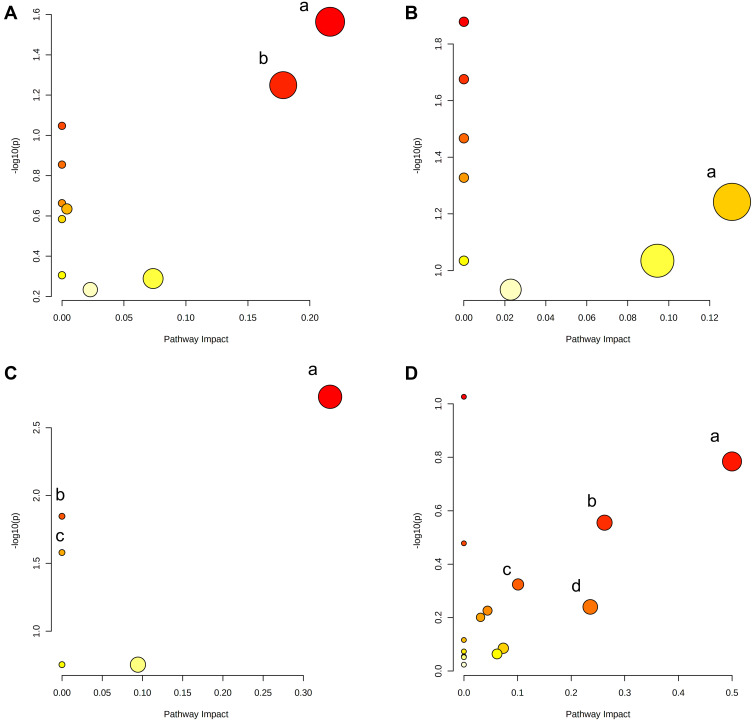
Figure 12.
Summary of pathway analysis of differentially expressed metabolites in feces (A), livers (B), serum (C) and urine (D). (A) a-Glycerophospholipid metabolism; b-Sphingolipid metabolism. (B) a-Pentose phosphate pathway. (C) a-alpha-Linolenic acid metabolism; b-biosynthesis of unsaturated fatty acids (P<0.05); c-linoleic acid metabolism (P<0.05). (D) a-Phenylalanine, tyrosine and tryptophan biosynthesis; b-Tyrosine metabolism; c-Arachidonic acid metabolism; d-Pantothenate and CoA biosynthesis.

