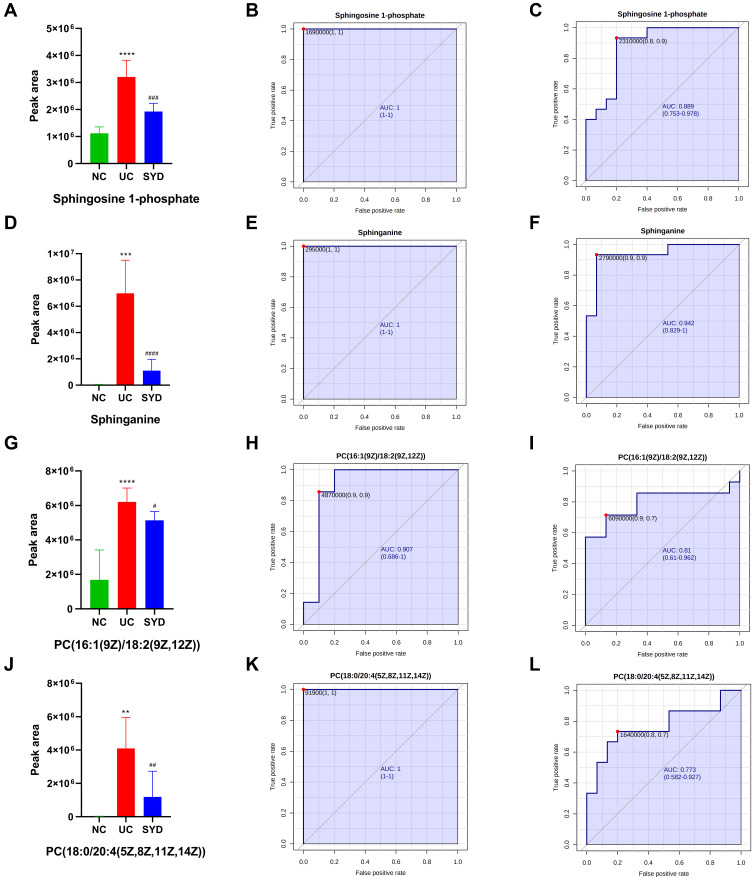
Figure 14.
Histogram and the corresponding ROC curves of sphingosine 1-phosphate (S1P) (A–C) and sphinganine (D–F), PC(18:0/20:4(5Z,8Z,11Z,14Z)) (G–I) and PC(16:1(9Z)/18:2(9Z,12Z)) (J–L). (B) ROC curve between model group and normal group for S1P. (C) ROC curve between model group and SYD group for S1P. (E) ROC curve between model group and normal group for sphinganine. (F) ROC curve between model group and SYD group for sphinganine. (H) ROC curve between model group and normal group for PC(18:0/20:4(5Z,8Z,11Z,14Z)). (I) ROC curve between model group and SYD group for PC(18:0/20:4(5Z,8Z,11Z,14Z)). (K) ROC curve between model group and normal group for PC(16:1(9Z)/18:2(9Z,12Z)). (L) ROC curve between model group and SYD group for PC(16:1(9Z)/18:2(9Z,12Z)). **p<0.01, ***p<0.001, ****p<0.0001, compared to normal group; #p<0.05, ##p<0.01 ###p<0.001, ####p<0.0001, compared to model group.

