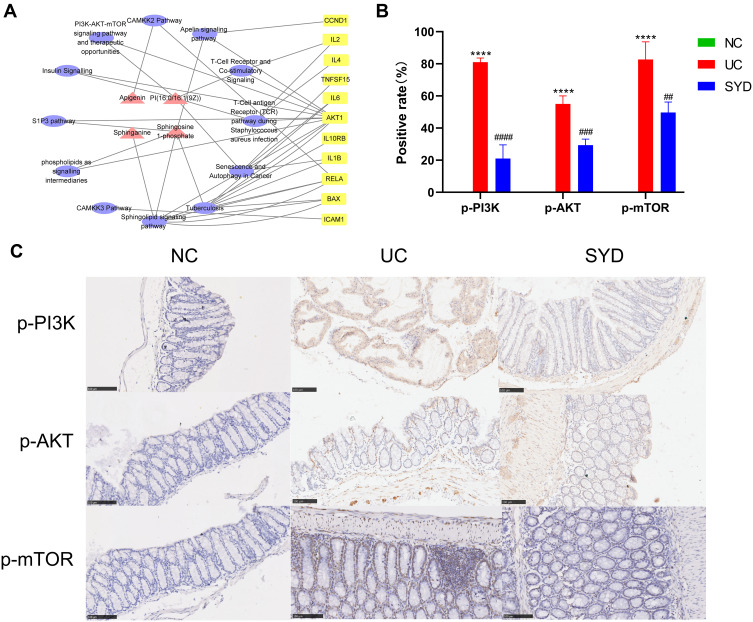
Figure 18.
The metabolite-pathway-target network (A) and immunohistochemistry of p-PI3K, p-AKT and p-mTOR on sections from colonic tissues in each groups (B and C). (A) Red triangles represent metabolites, yellow squares represent genes, and purple circles represent pathways. (B) ****p<0.0001, compared to normal group; ##p<0.01 ###p<0.001, ####p<0.0001, compared to model group. (C) Scale bar size is 100μm.

