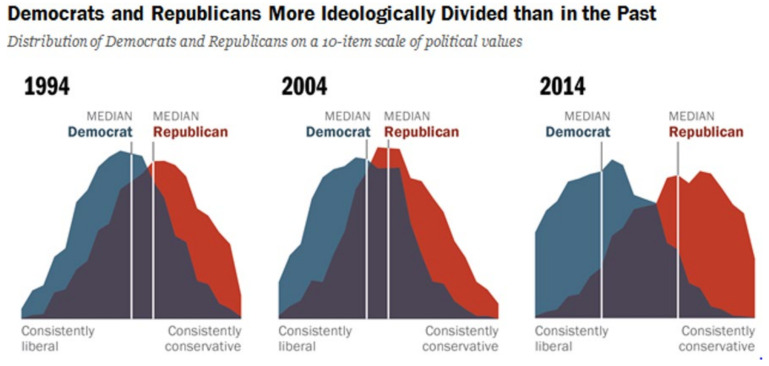
Figure A2.
Polarization figures 1994–2014. Ideological consistency was established with a scale of 10 political value questions. The blue and red area represent the ideological distribution of Democrats and Republicans respectively. The purple area represents the overlap between the two. Republicans and Democrats include Republican- or Democratic-leaning independents respectively [11].

