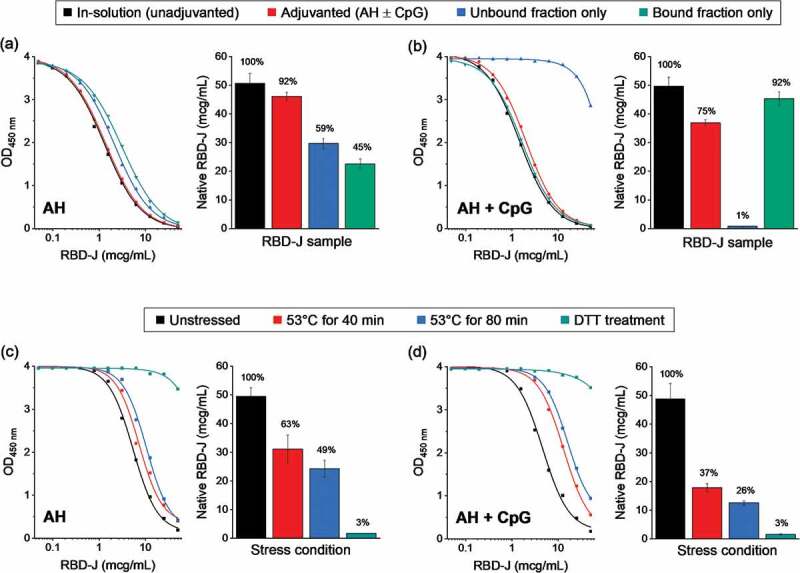
Figure 3.

Competitive ELISA method development to measure the ACE2 binding of RBD-J in the presence and absence of adjuvants. Representative dose–response curves along with measured native RBD-J concentration in (a) AH-adjuvanted and (b) AH+CpG-adjuvanted formulations. Adjuvanted drug product, along with unbound and bound fractions of the drug product (generated by centrifugation of the sample) were compared to unadjuvanted in-solution RBD-J reference. Representative dose response curves along with measured native RBD-J concentration from forced degradation studies on (c) AH and (d) AH+CpG-adjuvanted formulation. Partially and completely denatured RBD-J samples (heat and DTT treatment, respectively) were adjuvanted and then compared to the corresponding unstressed adjuvanted RBD-J reference. Bars represent mean and error bars represent range of values with n = 2 (2 independent runs). For each test condition, the percentage of native RBD-J relative to reference is indicated above the bars.
