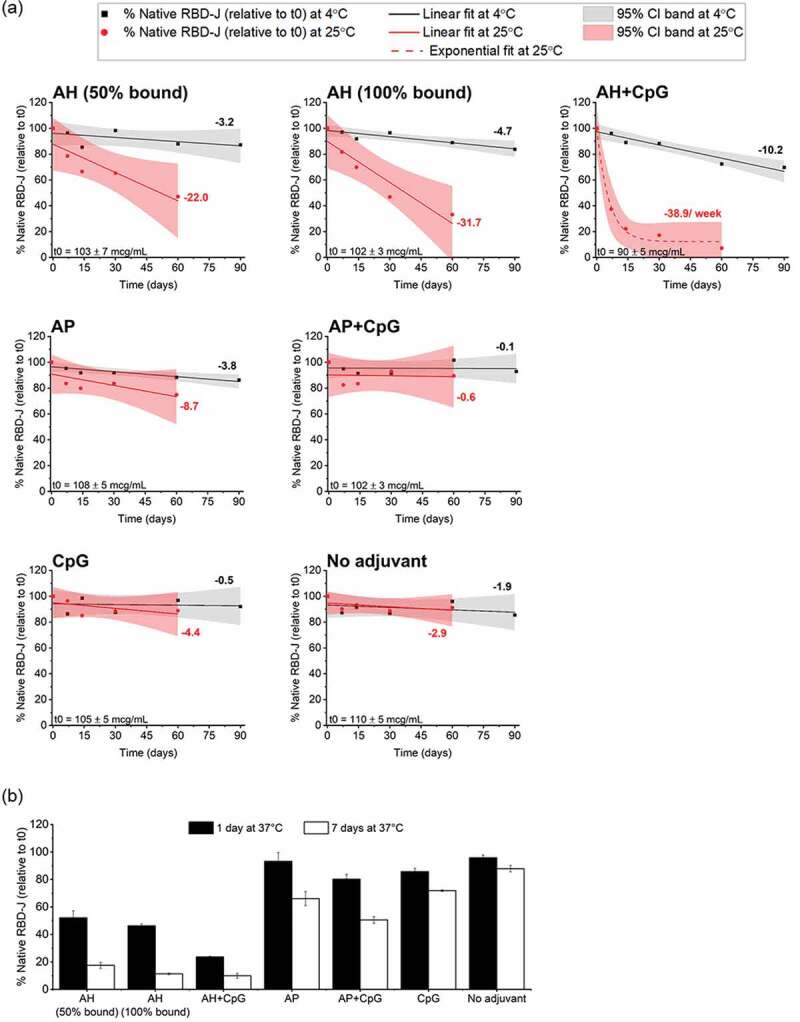
Figure 4.

Stability profile of RBD-J in formulations F1-F7 at 4, 25 and 37°C as measured by competitive ELISA. (a) Stability at 4°C and 25°C up to 90 days and 60 days, respectively. Concentration of ACE2-binding native RBD-J at each time point was normalized against values at time zero (t0) and then plotted as a function of time. Solid lines at 4°C (black) and 25°C (red) represent linear regression fit of data points and the corresponding slope values displayed alongside represent percentage loss per month. The red dotted line at 25°C for AH+CpG formulation represents best exponential fit and the indicated slope for percentage loss per week was determined by fitting t0, 7 days, 14 days data points to linear model. The shaded bands indicate the 95% confidence interval. The measured concentration of RBD-J at t0 in each formulation is displayed at the bottom right as mean ± SD (n = 4). (b) Percentage of native RBD-J, relative to t0, remaining in each formulation after 1 day and 7 days at 37°C is presented as mean ± SD for n = 4 measurements.
