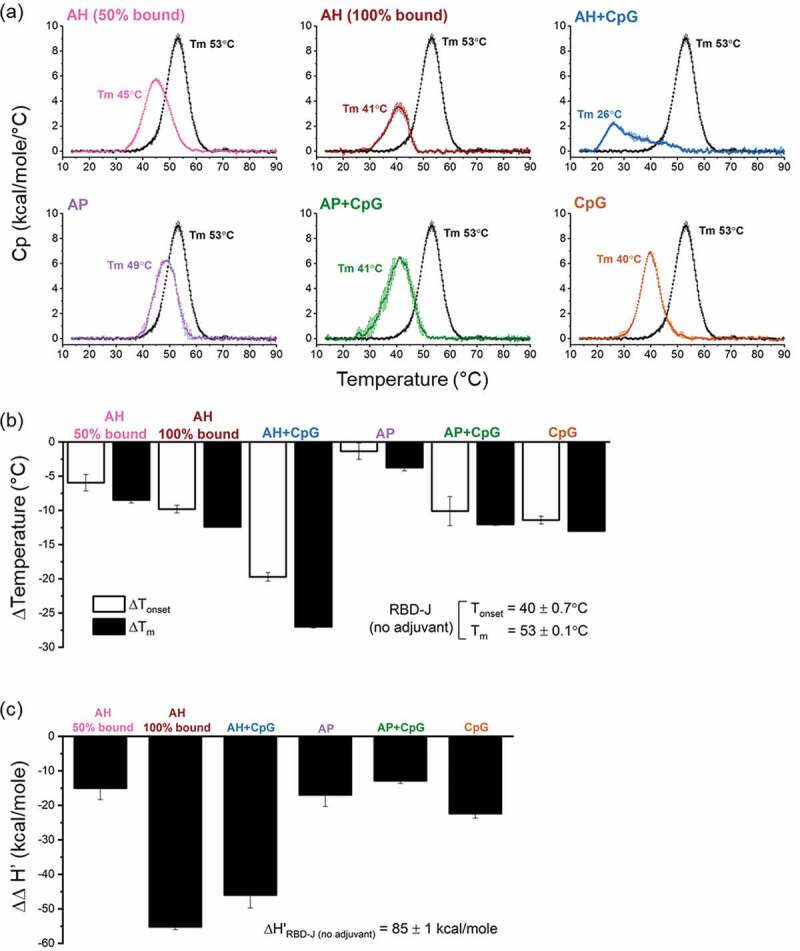
Figure 5.

Conformational stability of RBD-J in formulations F1-F7 as measured by DSC. (a) Representative DSC thermograms of RBD-J in each formulation. DSC thermogram of unadjuvanted in-solution RBD-J (black) is plotted alongside each adjuvanted formulation for comparison. Thermal unfolding temperature (Tm) values are shown as the mean of n = 2 measurements with range = ± 0.1–0.6°C. Effect of adjuvants on (b) ΔTonset and ΔTm values and (c) Δapparent enthalpy (∆∆H’) values of RBD-J in F1-F6 as determined by subtracting the results for each formulation from respective values of the unadjuvanted in-solution RBD-J control. Bars indicate mean of n = 2 measurements and the errors bars represent the data range.
